Larry Pesavento's Insights on the Markets & Charts
Click image for original size
Click image for original size
----- Original Message -----
From: Ermanometry Research Alerts
Sent: Friday, January 23, 2009 4:54 AM
Subject: Timing Elements 01/22-26 Macro Ezone
Ermanometry Research http://ermanometry.com
PO Box 210315 Nashville, TN 37221 Phone:615-646-8040
Timing Elements 01/22-26 Macro Ezone
(Mailing list information, including unsubscription instructions, is located at the end of this message.)
From our note of January 11:
"As of today, January 11, DJIA and S&P reached their intraday highs on January 6, the first day of the recent Ezone, January 6- 8, Focus Day January 7. These highs are now an important benchmark and if and when they are exceeded it would indicate the indices should advance at least another 2-5 percent within one-two weeks. The next Major Ezone we are currently looking at is January 21-23, Focus Day, January 22. There is the possibility that Monday, January 26, will be added to this Ezone."
The most recent Ezone, Jan 6, reversed S&P cash 140 points intraday. The indices are now about to bump into the January 21-23 period mentioned above.
IMPORTANT CHANGE: The 01/21-23 period is now upgraded from a Major Ezone to a Macro Ezone. Also, the Focus Day moves forward one day, to Friday, January 23. The reason is that Monday, January 26 has the greatest number of significant Timing Elements, followed by Friday, January 23, and Thursday, January 22.
Representative Timing Elements for Jan. 22-26 will be forwarded shortly.
______________________________________________________________
Thursday, January 22: A FEW TIMING ELEMENTS FOR January 22-26
Fib and Golden Mean Near and Mid Term
10/11/07 top - 01/26/09 = 324 days (3.236)
07/15/08 low - 01/26 = 134 days
11/04/08 top - 01/26 = 55 days
01/06/09 top - 01/26 = 13 days
10/10/02 low - 01/23 = 1582 days
09/97 top BP - 10/10/02 = 1280 days
1280 x 1.236 = 1582 days
11/94 btm. BP - 10/10/02 = 1979 days
1979 x .8 = 1583 + 10/10/02 = 01/26
Pi
One of the best examples of order in the markets is the 3141 day span from the 1987 crash low to the all time constant dollar S&P top, 03/24/2000.
3141 divided by the sq. rt. of 2, 1.4142, = 2221.
03/24/2000 + 2221 = 01/26/09
.854 is a Golden Mean ratio; 1.382 x .618
.854 x 2221 = 1897
03/24/2000 top + 1897 = 10/11/2007 top
Symmetry
1982 low - 1987 top = 1273 days
2004 Top BalancePoint (2000 S&P/2007 DJIA CompoundPivot) - 01/26/09 = 1273 days
1273 x 5.236 = 6675
1982 low + 6675 = 01/26/09
1974 S&P low - 1985 Invisible Ezone = 2602 days
1998 Btm. BP - 01/26/09 = 2602 days
Bottom Line
We want to stress again that this Macro Ezone is extremely important. The next few days should provide important guidance for the next several months.
___________________________________________________________________________________
1. Entry and exit decisions must be based upon technical indicators other than timing. Ezones are windows of opportunity (Interchange Analogy).
2. There will be more Ezones projected than the number of important market turns. That is the reason for #1 above.
3. Don't forget Invisible Ezones and Non-Events.
Thanks for sharing Robin...very interesting.
WOW, sure points out and reinforces my belief that an 'important' low could be reached this month!
Really enjoyed reading all of this, thank you for sharing with us Robin.
Interesting to see these folks work starting to line up with KoolBlue's daily chart projection.
Interesting to see these folks work starting to line up with KoolBlue's daily chart projection.
Stock indices
What are the advantages of being in this business for so long is that I have been able to surround myself with friends and colleagues that have many skills. This is certainly true in this study of astrology. Since the early days with Dr. Ruth Miller and my time with Jim
Twentyman at Drexel Burnham and of course Arch Crawford of Tucson Arizona. Recently several other astrologers have shared some of their research with me. This will be our focus for this weeks newsletter. As you recall the time frame from October 6 through October 11 was characterized by extreme volatility. We were fortunate enough to capture some of this move and now we are preparing for a similar type astrology event that began on January 20 which was" combust" and finishes on Sunday night January 25th. There are several scenarios that can unfold to make this a profitable event. There is a potential for a head and shoulders pattern in the Dow Jones and the S&P 500 as well as the NASDAQ. However, should this pattern fail it would make a three drive pattern at substantially lower prices.
What we must do is to decide what action to take. It is still too early to determine whether this is going to be a major low and stocks or we are going to have a acceleration to the downside. My bias has to be for a rally because the market was able to hold key Fibonacci support this week in face of a barrage of bearish news on the economy and particularly the financial sector.
The Astro aspects that are occurring should affect almost every market. This includes currencies, commodities, and of course the stock market. This would be a rally in a bear market. Below from late November 2008 will be exceeded in my opinion some time between now and early spring. The best way for me to communicate my interpretation of the coming events will be to send out alerts starting Sunday, January 25th. Keep in mind that you must use proper money management and above all stoploss orders to prevent catastrophic losses. We do not want to be put into a situation like Enron, General Motors, Ford, Citicorp etc.!
Treasury bonds
This market has acted quite well since we issued our trade of the year to short treasury bonds and the ETF's TLT and long the TBT. We are now nearing a major A.B. equal CD level that should give this falling knife at least some relief. I am of the opinion, that treasury rates will move higher in the coming months mainly because of the amount of debt but the treasury must issue an order to pay for all of the bailout programs.
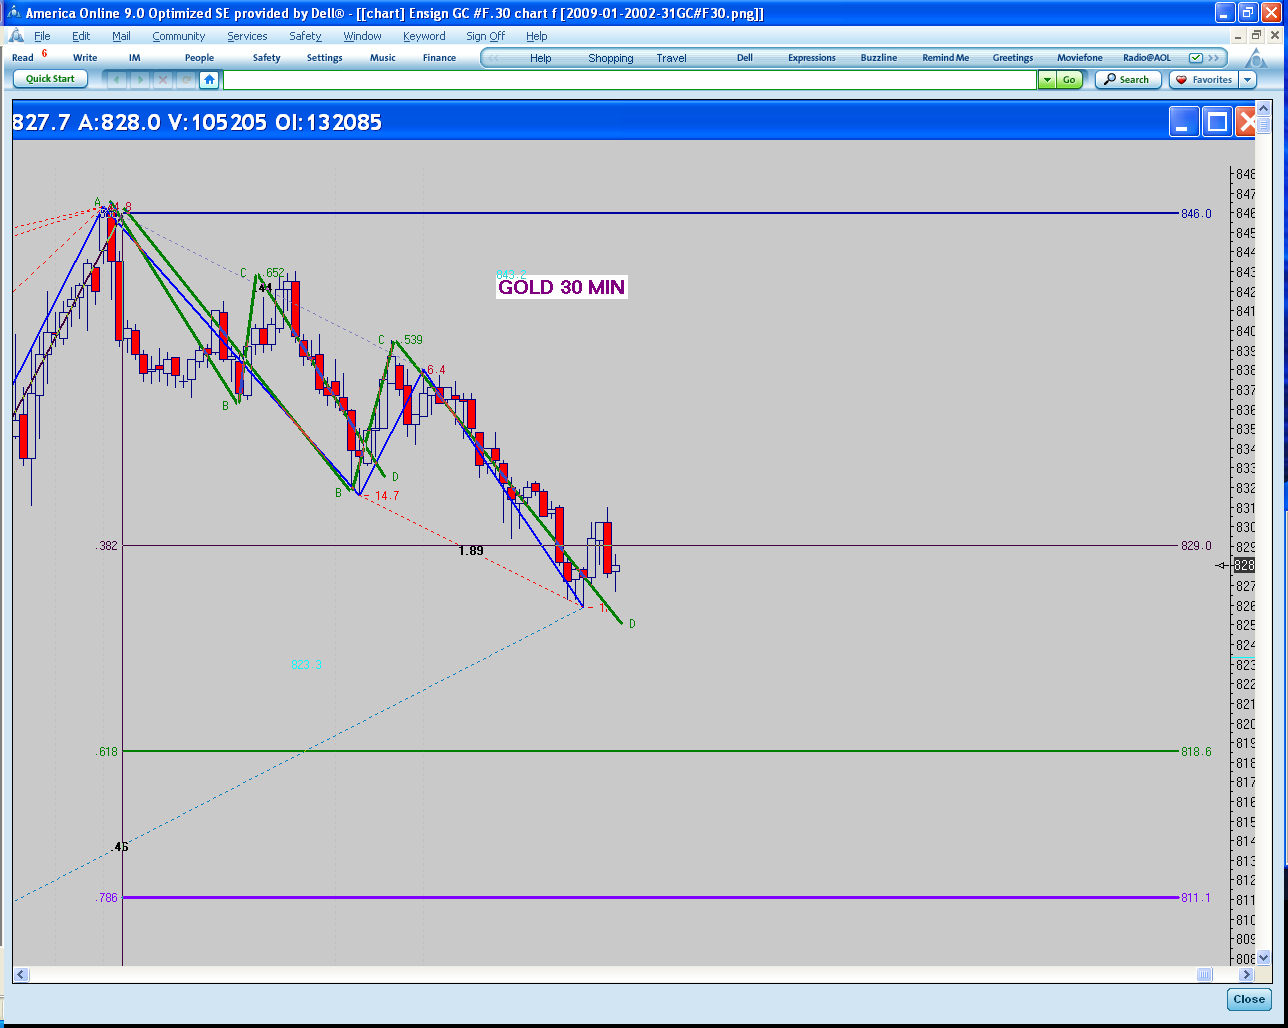
Gold
Gold has exceeded the recent weekly highs and appears to be poised to move much higher. However, gold has been up the last seven days in a row which usually brings a correction. The correction to the $800/oz level offered a low risk buying opportunity as we pointed out in our last letter. Should gold exceed $900 per ounce we could be looking at gold substantially above the $1000 per ounce level in 2009! Given the atmosphere in our financial markets this is not a stretch of imagination.
Foreign currency
Both the euro and British pound were under extreme pressure this week and made new lows for the week. The British pound has formed a a three drive to the bottom pattern on the daily. It is very important that the British pound does not go below the 1.3400 level. Should that occur the pound could easily go to1.2900 or even par 1.000! What is really amazing is that the relationship between the euro and gold has disintegrated. Previously the euro and gold exhibited a high correlation. This is certainly not the case presently.
Grains and oilseeds
These markets are consolidating their recent moves but have the potential to move much higher. This would be nothing more than a rally in a vicious bear market. Presently there are no patterns that offer low risk entries either on the short side or the long side.
In summary, the real test of these markets is going to occur in the next 3 to 4 days. Will use all of our tools to try to enter positions that offer the lowest possible risk in the highest profitable profit.
What are the advantages of being in this business for so long is that I have been able to surround myself with friends and colleagues that have many skills. This is certainly true in this study of astrology. Since the early days with Dr. Ruth Miller and my time with Jim
Twentyman at Drexel Burnham and of course Arch Crawford of Tucson Arizona. Recently several other astrologers have shared some of their research with me. This will be our focus for this weeks newsletter. As you recall the time frame from October 6 through October 11 was characterized by extreme volatility. We were fortunate enough to capture some of this move and now we are preparing for a similar type astrology event that began on January 20 which was" combust" and finishes on Sunday night January 25th. There are several scenarios that can unfold to make this a profitable event. There is a potential for a head and shoulders pattern in the Dow Jones and the S&P 500 as well as the NASDAQ. However, should this pattern fail it would make a three drive pattern at substantially lower prices.
What we must do is to decide what action to take. It is still too early to determine whether this is going to be a major low and stocks or we are going to have a acceleration to the downside. My bias has to be for a rally because the market was able to hold key Fibonacci support this week in face of a barrage of bearish news on the economy and particularly the financial sector.
The Astro aspects that are occurring should affect almost every market. This includes currencies, commodities, and of course the stock market. This would be a rally in a bear market. Below from late November 2008 will be exceeded in my opinion some time between now and early spring. The best way for me to communicate my interpretation of the coming events will be to send out alerts starting Sunday, January 25th. Keep in mind that you must use proper money management and above all stoploss orders to prevent catastrophic losses. We do not want to be put into a situation like Enron, General Motors, Ford, Citicorp etc.!
Treasury bonds
This market has acted quite well since we issued our trade of the year to short treasury bonds and the ETF's TLT and long the TBT. We are now nearing a major A.B. equal CD level that should give this falling knife at least some relief. I am of the opinion, that treasury rates will move higher in the coming months mainly because of the amount of debt but the treasury must issue an order to pay for all of the bailout programs.
Gold
Gold has exceeded the recent weekly highs and appears to be poised to move much higher. However, gold has been up the last seven days in a row which usually brings a correction. The correction to the $800/oz level offered a low risk buying opportunity as we pointed out in our last letter. Should gold exceed $900 per ounce we could be looking at gold substantially above the $1000 per ounce level in 2009! Given the atmosphere in our financial markets this is not a stretch of imagination.
Foreign currency
Both the euro and British pound were under extreme pressure this week and made new lows for the week. The British pound has formed a a three drive to the bottom pattern on the daily. It is very important that the British pound does not go below the 1.3400 level. Should that occur the pound could easily go to1.2900 or even par 1.000! What is really amazing is that the relationship between the euro and gold has disintegrated. Previously the euro and gold exhibited a high correlation. This is certainly not the case presently.
Grains and oilseeds
These markets are consolidating their recent moves but have the potential to move much higher. This would be nothing more than a rally in a vicious bear market. Presently there are no patterns that offer low risk entries either on the short side or the long side.
In summary, the real test of these markets is going to occur in the next 3 to 4 days. Will use all of our tools to try to enter positions that offer the lowest possible risk in the highest profitable profit.
Hello Robin,
I came across Ermanometry in 2007. However, all his examples on the site realted to 2002 and before. Maybe it's changed by now.
You had to buy a book. No contact to discuss or opine on any issues.
Tell me what will happen in the FUTURE....I do that with my guesses....and most of mine have come true.
Granted, I never ventured to pursue it further with Ermanometry, but Murray is just as good and there are 2 other sources that are very good when it comes to this thing.
The concept is Pi. And T.Henning Murray is the Front runner in all of this back to 1993 or 1992.
Many people or should I say people sellling courses are emulating Murray. I would like to know the purveyor of Ermanometry. Give me some trades on ES, YM, ER..ooops TF now and the like...meaning commodities.
I like to take calls, not buy courses.
My commodities trades are my own, but I confirm it with a trader from 1972 and he is WAY, WAY, WAY better than me and his trade calls are so cheap!! He is just a nice guy...something to do with the lord or spirituality.
Nonetheless, Pi has a lot of merit, but not for intraday trading. Its for longer term trading and decisions.
Robin, give me a trade or some numbers so I can make some money!!!
I know ES, YM is going down to 650-550 then to 350; 6,800-6,500 and 3,500 or lower on the YM. April 2009 will bring a great downturn. 2011 has a smell to it.
Personally, I could see the Dow get back to the 1979 levels....by 2011/2016 and if it comes true....it's not me to take credit...but J.**l*e*. Yes, I may it difficult..... but when I started out....it was BS....traders spend over 8,000 hours and you will learn something to make you a lot of money. Put in the time, like I did.
I could be selling courses...but I just can't be like Bernie Madoff!!! However, I would like to talk to him and found out how he managed to get MONEY FROM ALL THOSE EDUCATED SMART PEOPLE...or are they fools. $50 Billion and counting.
Robin its wonderful you let us know all this...but how does a neophyte make any money now.
Just give them a trade!!!
To all, Jan 28 is a turning date...and watch April 19 or is it 16...refill it's green label...good stuff.
Best.
Uncle Remus..circa 1974
I think it's strange and dare I say it seems "Curve fitted" that these astro events happen near the fed meetings where big moves tend to take place......You can go back and look at the October 6- 9th astro event and then look to see when the Fed meeting took place.....
I think Larry has done good work with pattern recognition ( at least in helping to spread the word) but this is a bit too much for me......not an insult to anyone...just my opinion...nothing else intended
I think Larry has done good work with pattern recognition ( at least in helping to spread the word) but this is a bit too much for me......not an insult to anyone...just my opinion...nothing else intended
Apparently Ruth Miller ran of 12 winning silver trades in a row back in the 70's or was in '79 to Pesavento and then he supposedly took a keen interest in Astrology.
So Ruth is/was good and she was a house wife when she did this. Somebody told me her expertise was Time. A fellow told me she would call her broker up and tell him to sell or buy at a certain TIME. She knew TIME was "UP."
Don't know where she is now...but I do believe their is merit to astro stuff. However, very few are any good in terms of making any money.
Pesavento, I do not know anything about, but he does write some good articles and I gather is a good trader as he's been around a long time and I have not seen him in any infomercial like Jake Bernstein with his nonsense.
Jake is a terrible trader according to his broker, but he can sell books and videos and seminars.
You can try financialastronomy.com. Frederick is a nice, honest chap. I used him 2 months in 2007. Nonetheless, he will be able to help newbie traders grasp the feel for the markets.
And Robin to continue with your information. I did not mean to put you off. Most if not all would like to read your gauge of the markets.
Maybe a prediction on a number for the bottom and when via Ermanometry??.
Morning pips....
You did not put me off. I'm only posting Larry's stuff for those interested. Pattern recognition is his main tool for trading....but is aware of what "might" be important astro events that "may" have an impact on the markets. However, the pattern and fib levels come first. I think he's more interested in these astro events if the markets are at a critical pattern completion or fib level.
As for Ermanometry.... I get various newsletters forwarded to me and again, thought for those with an interest in astro they might find it of interest. I honestly don't know anything about them as I've never dealt with them but I thought this particular newsletter was worth posting as their dates lined up with Larry's and KoolBlue's.
I was however, very interested in your post. I will be watching with keen interest how the markets are looking into your April 16th or 19th. :):) You've posted some very interesting information as well as your 2 important turn dates. I hope you're right and we bottom on the 28th and have a nice rally into the April dates....nothing goes down in a straight line so a nice bear market rally would be welcomed. Anyway, I'm new to this site and just wanted to post some things that might be interesting to some as I'm very impressed with the posters here and wanted to try and give back a little.
I will look forward to all of your future posts!!!
Take Care,
quote:
Originally posted by rfarina187
Pattern recognition is his main tool for trading....but is aware of what "might" be important astro events that "may" have an impact on the markets. However, the pattern and fib levels come first. I think he's more interested in these astro events if the markets are at a critical pattern completion or fib level.
I refer to this as "cluster theory" (I might be the only person who uses this term as I haven't seen it elsewhere) and believe that it has validity. It's a simple concept that states that the more indicators that signal a turn the more likely the turn will take place because more people will counter-trade that point in time. i.e. The bigger the cluster the more likely it will work.
The stock market attempted to make new highs again today. In fact, the
NASDAQ was able to make new highs. This presents a potential problem for the
Bears, or a great opportunity. Divergence between similar contracts can be
highly indicative of a major trend change. As you can see from the enclosed
chart, the NASDAQ easily exceeded last week's highs, while at the same time
the S&P 500 (i.e. Dow Jones also) were unable to do so! The bearish case is
still up for grabs. Any move in the S&P 500 above 875 would mean that we are
going higher. The figure for the Dow Jones is 8112. This week will be
critical to what happens going into May 18th which is our next Astro
harmonic date( combust ).
This weekend we will present a comprehensive pattern analysis on all the
major markets as we are approaching some completion of very significant
patterns.
Emini Day Trading /
Daily Notes /
Forecast /
Economic Events /
Search /
Terms and Conditions /
Disclaimer /
Books /
Online Books /
Site Map /
Contact /
Privacy Policy /
Links /
About /
Day Trading Forum /
Investment Calculators /
Pivot Point Calculator /
Market Profile Generator /
Fibonacci Calculator /
Mailing List /
Advertise Here /
Articles /
Financial Terms /
Brokers /
Software /
Holidays /
Stock Split Calendar /
Mortgage Calculator /
Donate
Copyright © 2004-2023, MyPivots. All rights reserved.
Copyright © 2004-2023, MyPivots. All rights reserved.