Larry Pesavento's Insights on the Markets & Charts
Click image for original size
Click image for original size
that gave me a well needed laugh VO......thanks...
Click image for original size

Click image for original size
INSIGHT O/N THE MARKETS
Stock market
This past week the market rallied approximately 5% led by the NASDAQ which has been the strongest of the indices over the last six or seven weeks. As we suggested in our last letter the positive cycles that bottomed on January 24 26 have led to a rally that now has brought a few buyers back into the market. The head and shoulders pattern that we pointed out in the S&P 500 has been completed and the question now arises as to whether we will continue up over the next few weeks. Several Gartley patterns are forming that would suggest that we are ready for another down leg in this long-term bear market. The Dow transportation index has made a double bottom but is still rather dubious if it can hold. The Dow utility Index has been the strongest and has higher bottoms since its October low. The VIX index of volatility is showing a short-term Gartley pattern that would suggest a correction in the recent move.
They are are a cluster of Astro aspects occurring between March 4 and March 8 that usually are associated with negativity. This would suggest that we would be going down into that timeframe. This is the exact opposite of what occurred on January 24/26 when the cycles turned positive. Please keep in mind that this is just a probability and far from being a certainty.
Treasury bonds
Our trade of the year in short treasury bonds has been completed as we took profits on Friday, February 6. The reason is quite simple. Bonds have completed a Gartley pattern and we are expecting a rally where we will reinstate our short position and continue to look for lower bond prices i.e. higher interest rates over the next coming months. We believe long-term interest rates have made a generation type bottom that occurs approximately every 60 to 80 years.
Foreign currency
There so many opinions of what is going to happen to the US dollar and British pound and euro currency that it would take more time than I have left on this planet to explain. As you can see from the enclosed charts all of these markets are approaching key support and resistance levels and pattern completions. Of particular interest is the British pound at the 1.4900 level and the US dollar index at the 88.00 level. Frankly, it seems that no one wants to own any particular currency with gold being the only exception. This is not uncommon when so much negativity is in the news. The Japanese Yen has had a long-standing target of 83.00. It is beginning to appear that this target might not be reached. Any move in the Japanese Yen above 93.00 would suggest that the trend could be turning up.
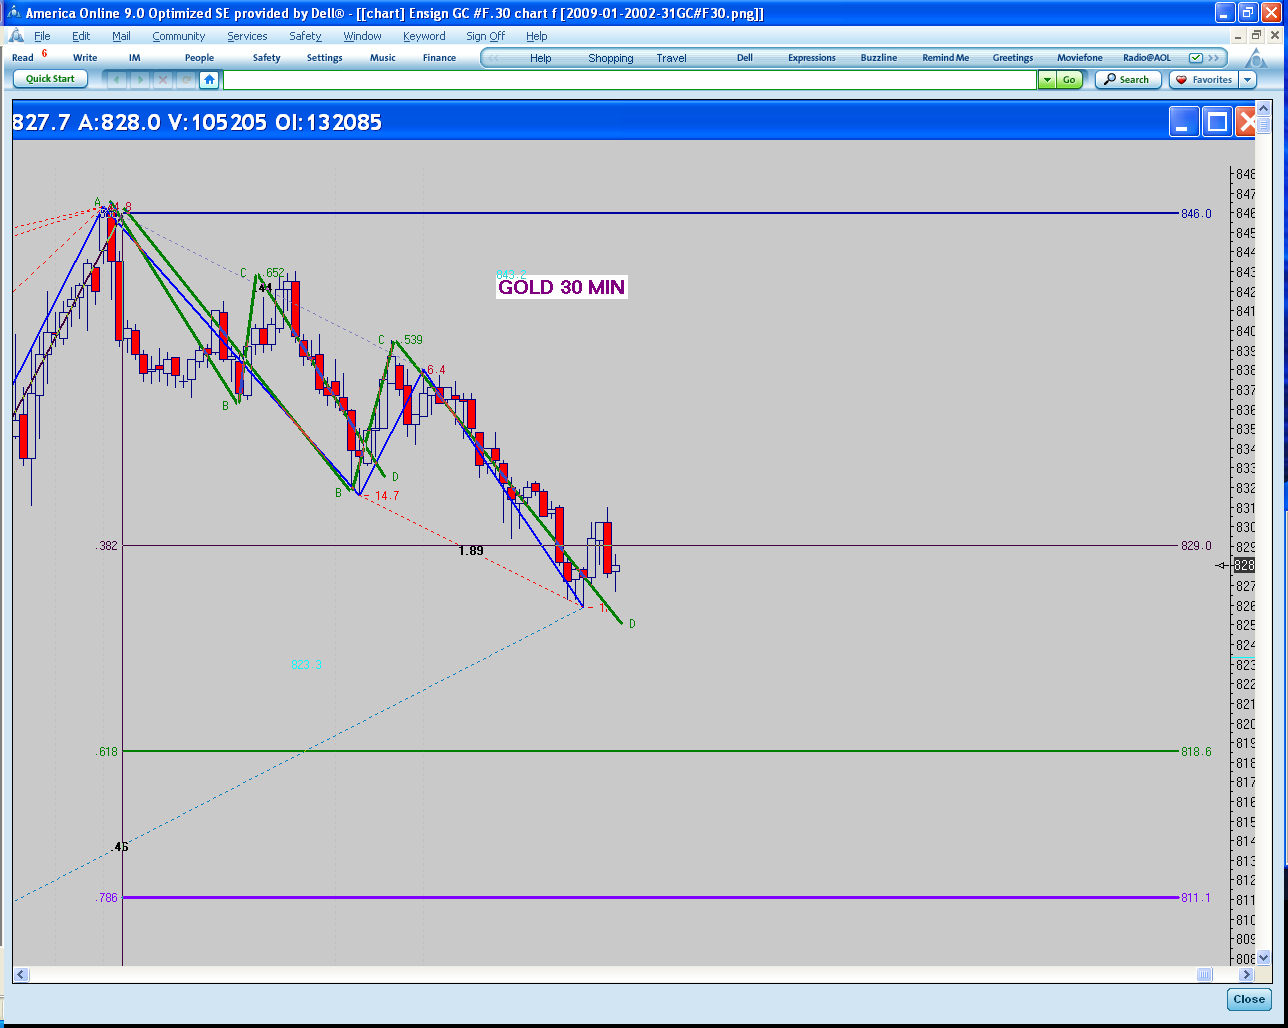
Gold
This this market has been the strongest of all the commodity markets and is approaching the point where it it could easily break out above $1000 per ounce. It is very important that gold not drop below 875 per ounce in the next few trading days. The reason for this is that the cycle bottomed exactly at the .618 retracement of the previous swing and then proceeded to rally over $60 per ounce. Falling below 875 per ounce would constitute a cycle failure and most probably lead to lower prices near $790 per ounce. Should gold close above $970 per ounce it could easily reach $1130 per ounce over a few weeks. The news certainly is in favor of higher gold prices but that can change at a moments notice.
Crude oil
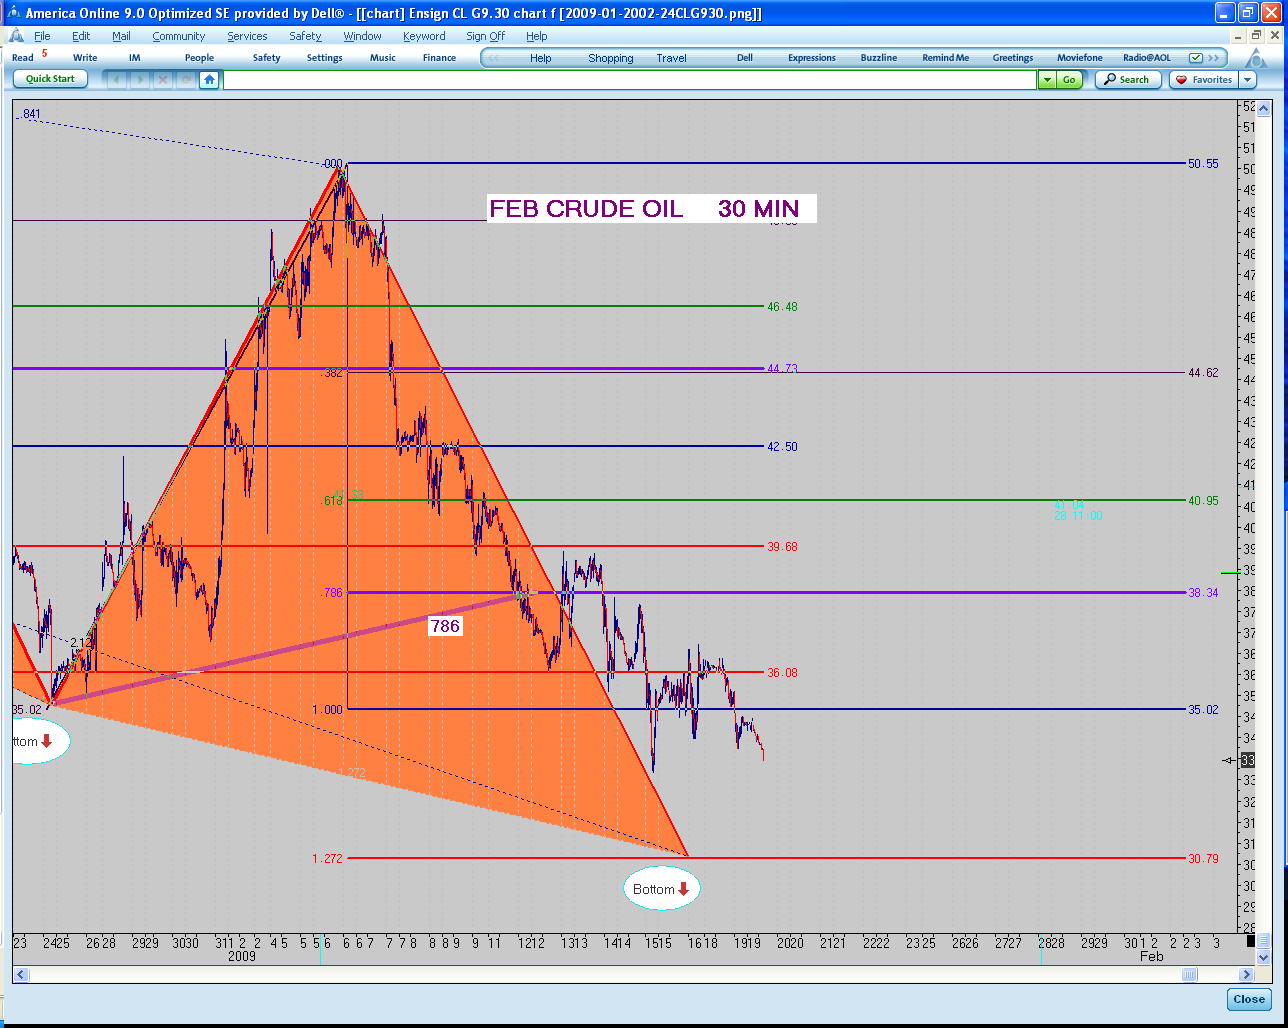
Oil is moving in a trading range between $35 and $45 per barrel. It has been down 10 days in a row and at the same time the price of unleaded gasoline has moved substantially higher. It is a mystery that gasoline goes higher as crude oil goes lower. Back in the days of the big bull market in oil a three or four dollar rise in oil would automatically equate to a $.10 per gallon increase in gasoline or more. Bear markets act quite differently as all the Bulls for crude oil have left the building and no one can see oil any higher than $50 per barrel over the coming months, there are however a few exceptions. Oil tested the 61% retracement of the last major low this week at $39 per barrel and as long as we can hold above this level we think that crude could rally substantially more than $50 per barrel on the spot market. Our first objective would be $75 per barrel.
Grains and oil seeds
These markets have rallied from a catastrophic drop and are now forming potential bearish Gartley patterns. Patterns take time to unfold so at this time there is really not a completion that I can see. They do bounce off of the Fibonacci numbers quite nicely for day trading purposes but for a longer-term recommendation I think it would be best to wait.
Conclusion
We are living in a history making time. Our assumption that this is the 170 year debt cycle appears to be right on track. It was in 1837 that we had a similar panic based on similar fundamental and Astro harmonic events. I think it is prudent for all of us to own the little gold and a little silver along with some stored foods and plenty of water. I am not trying to be an alarmist but there are times in history where if you are unprepared you pay a very high price. Go to Google and type in the panic of 1837 and you will see some of the ramifications of not being prepared.
Stock market
This past week the market rallied approximately 5% led by the NASDAQ which has been the strongest of the indices over the last six or seven weeks. As we suggested in our last letter the positive cycles that bottomed on January 24 26 have led to a rally that now has brought a few buyers back into the market. The head and shoulders pattern that we pointed out in the S&P 500 has been completed and the question now arises as to whether we will continue up over the next few weeks. Several Gartley patterns are forming that would suggest that we are ready for another down leg in this long-term bear market. The Dow transportation index has made a double bottom but is still rather dubious if it can hold. The Dow utility Index has been the strongest and has higher bottoms since its October low. The VIX index of volatility is showing a short-term Gartley pattern that would suggest a correction in the recent move.
They are are a cluster of Astro aspects occurring between March 4 and March 8 that usually are associated with negativity. This would suggest that we would be going down into that timeframe. This is the exact opposite of what occurred on January 24/26 when the cycles turned positive. Please keep in mind that this is just a probability and far from being a certainty.
Treasury bonds
Our trade of the year in short treasury bonds has been completed as we took profits on Friday, February 6. The reason is quite simple. Bonds have completed a Gartley pattern and we are expecting a rally where we will reinstate our short position and continue to look for lower bond prices i.e. higher interest rates over the next coming months. We believe long-term interest rates have made a generation type bottom that occurs approximately every 60 to 80 years.
Foreign currency
There so many opinions of what is going to happen to the US dollar and British pound and euro currency that it would take more time than I have left on this planet to explain. As you can see from the enclosed charts all of these markets are approaching key support and resistance levels and pattern completions. Of particular interest is the British pound at the 1.4900 level and the US dollar index at the 88.00 level. Frankly, it seems that no one wants to own any particular currency with gold being the only exception. This is not uncommon when so much negativity is in the news. The Japanese Yen has had a long-standing target of 83.00. It is beginning to appear that this target might not be reached. Any move in the Japanese Yen above 93.00 would suggest that the trend could be turning up.
Gold
This this market has been the strongest of all the commodity markets and is approaching the point where it it could easily break out above $1000 per ounce. It is very important that gold not drop below 875 per ounce in the next few trading days. The reason for this is that the cycle bottomed exactly at the .618 retracement of the previous swing and then proceeded to rally over $60 per ounce. Falling below 875 per ounce would constitute a cycle failure and most probably lead to lower prices near $790 per ounce. Should gold close above $970 per ounce it could easily reach $1130 per ounce over a few weeks. The news certainly is in favor of higher gold prices but that can change at a moments notice.
Crude oil
Oil is moving in a trading range between $35 and $45 per barrel. It has been down 10 days in a row and at the same time the price of unleaded gasoline has moved substantially higher. It is a mystery that gasoline goes higher as crude oil goes lower. Back in the days of the big bull market in oil a three or four dollar rise in oil would automatically equate to a $.10 per gallon increase in gasoline or more. Bear markets act quite differently as all the Bulls for crude oil have left the building and no one can see oil any higher than $50 per barrel over the coming months, there are however a few exceptions. Oil tested the 61% retracement of the last major low this week at $39 per barrel and as long as we can hold above this level we think that crude could rally substantially more than $50 per barrel on the spot market. Our first objective would be $75 per barrel.
Grains and oil seeds
These markets have rallied from a catastrophic drop and are now forming potential bearish Gartley patterns. Patterns take time to unfold so at this time there is really not a completion that I can see. They do bounce off of the Fibonacci numbers quite nicely for day trading purposes but for a longer-term recommendation I think it would be best to wait.
Conclusion
We are living in a history making time. Our assumption that this is the 170 year debt cycle appears to be right on track. It was in 1837 that we had a similar panic based on similar fundamental and Astro harmonic events. I think it is prudent for all of us to own the little gold and a little silver along with some stored foods and plenty of water. I am not trying to be an alarmist but there are times in history where if you are unprepared you pay a very high price. Go to Google and type in the panic of 1837 and you will see some of the ramifications of not being prepared.
Market Alert
Since the market bottomed in November of 2008, we have had a very minor rally. When we first became bearish in 2007, it was based on the long term cycle (170 year) which will not be due to bottom until late 2011. The similarities between the great crash of 1837 and what is occurring now are striking to say the least. Those of you that have an interest should google the crash of 1837 to read the effects and causes of that era. I have long believed that history is a great guideline to what will happen in the future. The reasoning behind this, it is human nature to make the same mistakes made by our predecessors.
I believe the market is ready for another downleg starting immediately. My reasoning behind this is:
1. The S&P 500 and Dow Jones are in danger of a "failed" head and shoulders pattern. This pattern is one of the more predictable in pattern recognition and when it fails it usually continues for quite some time. Remember that the trend is down as we have had lower highs.
2. The Dow Jones Transportation Index is at a double bottom which could fail easily.
3. The VIX Index of volatility is showing a bullish gartley pattern (which is bearish stocks).
4. The Banking Index is failing and is pointing towards lower prices.
There is a caveat here because the NASDAQ has been the strongest index and has had higher bottoms since the low in November. Should my analysis be correct, it would seem that the NASDAQ would start to play catch up to the other indices, thus falling a higher percentage on a relative basis.
As always we must be prepared to know when we are wrong. Should the stock market be up substantially in the coming week (taking out the highs of last week, 870 S&P) this would certainly be an indication that my analysis is wrong. However, if the market is down the coming week it would mean that the lows we are expecting between March 4th and 8th would mean new lows in the market. As I have stated previously, the March 4th thru 8th period has a very negative bias towards the market.
Treasury Bonds
Treasury Bonds had a minor rally this week but closed near the low of the week. If there is a bubble in treasury bonds they could also collapse giving further pressure on paper assets. I am frequently asked where should I put my money? The term cash is king refers to an actual speculative position. Those of you that own cash will be able to buy, in my opinion, assets at drastically reduced prices 20 to 30% of value in the coming years. One of my favorite examples of this was Joe Kennedy, the Patriarch of the Kennedy family. He bought the Chicago Mercantile building in 1933 for 20 cents on the dollar. (the building was built in 1927). At that time it was the largest commercial building in the world. 40 years later, the rental income on the building far exceeded the original purchase price and that was in 1970. So you can see why cash can be a valuable position.
The 4 major things that you can do now is:
1. Be out of all stock positions.
2. Have little or no debt.
3. Own some gold and silver coins.
4. If it appears that some of our banks i.e. Citibank, Bank of America, etc., are going to fail, I would also suggest to have some food and water stored (several months) in case we have a panic, ALA 1837.
Final Thoughts
No matter what happens here we will come out of this a stronger nation and probably a stronger global economy. These problems were caused by over speculation, too much credit and the lack of any watchdog on financial markets.
DEATH BY A 1000 CUTS.... “LINGCHI”
Insight on the Markets..
“Lingchi" is the Chinese word for the torturing technique also known as "Death by a 1000 Cuts.” Chinese literature emphases that this method of torture was used for only on those of the most heinous of crimes. Wouldn't it be interesting if we could use this on our 2 infamous financiers i.e. Maddox and Stanford. I'm sure this would put a dramatic halt to any future endeavors of this nature. What is happening in the stock market presently is very similar to "Lingchi". The market continues to go lower and lower exasperating anyone holding positions. It affects everything in their daily life. The reason that I know this is that I have been there and done that! Many years ago, I became a technician. My only belief is that the sum total of all the buying and selling will be reflected in the bar chart. If there's more buying prices go up and if there's more selling, prices go down, it's really that simple. Those of you that are skeptical about technical analysis should read Dr. Andrew Lo’s new book “The Heretics of Finance.” In this book Dr. Lo interviews 10 famous technicians who describe how their careers evolved as technicians. As you might remember, Dr. Lo is responsible for the use of so many charts in our financial press. “The Non Random Walk Down Wall Street”, a 700 page book that scientifically proves the validity and usefulness of analysis. This book categorically proves that the markets are chaotic in nature but within this chaos are non random patterns that repeat and are predictable.
We have been saying for the past year that we entered the worst bear market our county has ever seen and will not look for a major bottom until late 2011. However, there are going to be some really nice trading opportunities along the way. Markets don't go straight up and markets don't go straight down, they have rallies in-between the highs and lows. The Dow Jones made an 11 year low this week. When one considers that 3 of the Dow stocks (AIG, Citicorp, General Motors) does not total 5 dollars a share its amazing the Dow is where it is. Keep in mind that during the great depression 17 of the 30 Dow Stocks went bankrupt. This was a time when 3 of the most influential inventions in history were in their infancy i.e. the telephone, the automobile and electricity.
Last week in our special market alert we suggested that the head and shoulders pattern in stocks would bring on further selling and the market was down approximately 9% this last week. We have emphasized that the March 4th thru the 8th lows should initiate a rally that could last several weeks or even months. CAVEAT EMPTOR (buyer beware) This is my opinion and must be viewed as such. Fortunately I can send out a special alert at any time and I will most probably do so the week of March 4th thru 8th.
There is one particular ETF that has my interest. USO is for oil related stocks. If we do get a stock market rally it is my opinion that it could be lead by the oil sector which would also include a potential rise in the price of Crude Oil.
Treasury Bonds
Treasury Bonds completed a small AB=CD pattern this past week and if March Treasury Bonds go below 124.00 it would suggest another steep leg down. Ideally we would like to see a rally into the 133. 134 level in order to get short the Treasury Bonds once more. We remain bearish on bonds and feel that this market could be under extreme pressure for many weeks and months to come.
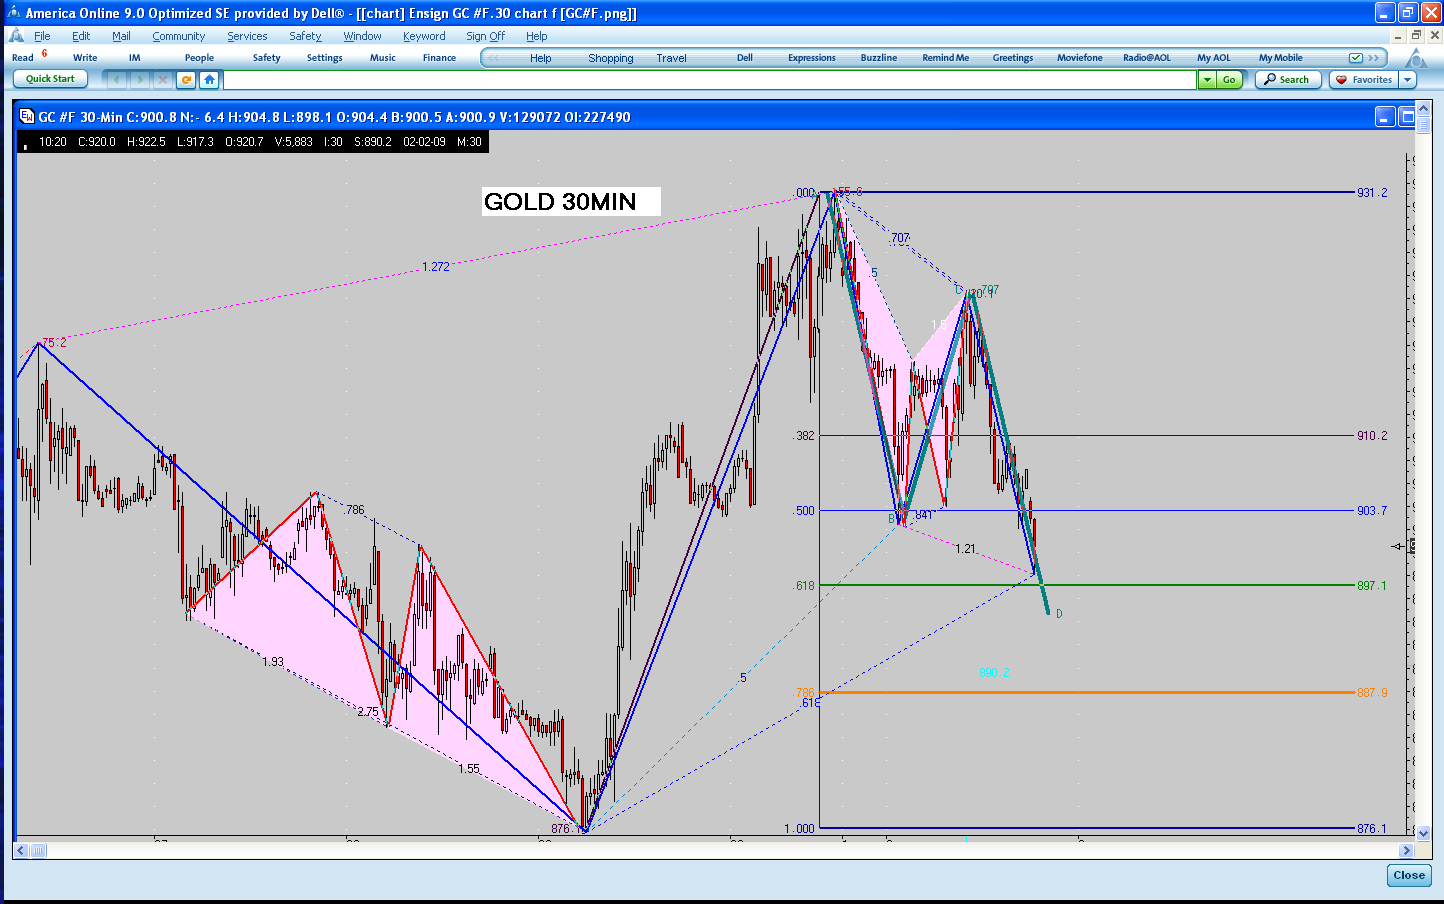
Gold
Our bullish position on gold was emphasized this week as Gold rallied more than $50.00 per ounce. This is the 5th straight upweek for gold and the first time that it has penetrated $1000. per ounce in the past year. We would like to see a pullback of $70.00 to $150.00 in order to buy more gold. This would be a good place to take some profits off the table because we are very close to a double top ($1030.00 per ounce).
Crude Oil
Crude Oil has tested the $35.00 per barrel level many times over the past 2 months. We still believe that we could get a very substantial rally i.e. above $70.00 per barrel in the coming weeks. As we mentioned before the ETF that has the interesting pattern i.e. a bullish butterfly appears to be ready to turn. Once again we want to emphasis that it is important to use stop loss protection on anything that your trade. Any move below $21.00 per share in USO would come under the heading of a “failed pattern.”
Foreign Currencies
The Dollar Index has broken to the upside and should hold the $85.00 level. If the dollar index goes below $85.00 it would signal another leg down in the US Dollar. The British Pound, Japanese Yen and Euro are all testing major support/resistance levels. At this time there are no completed patterns present in the 3 major cross rates. Should a pattern develop we will let you know via a special email alert.
Grains and Oilseeds
Soybeans, wheat and corn are probing for a bottom. Once the pattern develops I will let you ASAP via an email alert. As you can see from the enclosed charts a rally is certainly a possibility.
Insight on the Markets..
“Lingchi" is the Chinese word for the torturing technique also known as "Death by a 1000 Cuts.” Chinese literature emphases that this method of torture was used for only on those of the most heinous of crimes. Wouldn't it be interesting if we could use this on our 2 infamous financiers i.e. Maddox and Stanford. I'm sure this would put a dramatic halt to any future endeavors of this nature. What is happening in the stock market presently is very similar to "Lingchi". The market continues to go lower and lower exasperating anyone holding positions. It affects everything in their daily life. The reason that I know this is that I have been there and done that! Many years ago, I became a technician. My only belief is that the sum total of all the buying and selling will be reflected in the bar chart. If there's more buying prices go up and if there's more selling, prices go down, it's really that simple. Those of you that are skeptical about technical analysis should read Dr. Andrew Lo’s new book “The Heretics of Finance.” In this book Dr. Lo interviews 10 famous technicians who describe how their careers evolved as technicians. As you might remember, Dr. Lo is responsible for the use of so many charts in our financial press. “The Non Random Walk Down Wall Street”, a 700 page book that scientifically proves the validity and usefulness of analysis. This book categorically proves that the markets are chaotic in nature but within this chaos are non random patterns that repeat and are predictable.
We have been saying for the past year that we entered the worst bear market our county has ever seen and will not look for a major bottom until late 2011. However, there are going to be some really nice trading opportunities along the way. Markets don't go straight up and markets don't go straight down, they have rallies in-between the highs and lows. The Dow Jones made an 11 year low this week. When one considers that 3 of the Dow stocks (AIG, Citicorp, General Motors) does not total 5 dollars a share its amazing the Dow is where it is. Keep in mind that during the great depression 17 of the 30 Dow Stocks went bankrupt. This was a time when 3 of the most influential inventions in history were in their infancy i.e. the telephone, the automobile and electricity.
Last week in our special market alert we suggested that the head and shoulders pattern in stocks would bring on further selling and the market was down approximately 9% this last week. We have emphasized that the March 4th thru the 8th lows should initiate a rally that could last several weeks or even months. CAVEAT EMPTOR (buyer beware) This is my opinion and must be viewed as such. Fortunately I can send out a special alert at any time and I will most probably do so the week of March 4th thru 8th.
There is one particular ETF that has my interest. USO is for oil related stocks. If we do get a stock market rally it is my opinion that it could be lead by the oil sector which would also include a potential rise in the price of Crude Oil.
Treasury Bonds
Treasury Bonds completed a small AB=CD pattern this past week and if March Treasury Bonds go below 124.00 it would suggest another steep leg down. Ideally we would like to see a rally into the 133. 134 level in order to get short the Treasury Bonds once more. We remain bearish on bonds and feel that this market could be under extreme pressure for many weeks and months to come.
Gold
Our bullish position on gold was emphasized this week as Gold rallied more than $50.00 per ounce. This is the 5th straight upweek for gold and the first time that it has penetrated $1000. per ounce in the past year. We would like to see a pullback of $70.00 to $150.00 in order to buy more gold. This would be a good place to take some profits off the table because we are very close to a double top ($1030.00 per ounce).
Crude Oil
Crude Oil has tested the $35.00 per barrel level many times over the past 2 months. We still believe that we could get a very substantial rally i.e. above $70.00 per barrel in the coming weeks. As we mentioned before the ETF that has the interesting pattern i.e. a bullish butterfly appears to be ready to turn. Once again we want to emphasis that it is important to use stop loss protection on anything that your trade. Any move below $21.00 per share in USO would come under the heading of a “failed pattern.”
Foreign Currencies
The Dollar Index has broken to the upside and should hold the $85.00 level. If the dollar index goes below $85.00 it would signal another leg down in the US Dollar. The British Pound, Japanese Yen and Euro are all testing major support/resistance levels. At this time there are no completed patterns present in the 3 major cross rates. Should a pattern develop we will let you know via a special email alert.
Grains and Oilseeds
Soybeans, wheat and corn are probing for a bottom. Once the pattern develops I will let you ASAP via an email alert. As you can see from the enclosed charts a rally is certainly a possibility.
Hello Everyone....
I just wanted to let you all know that I asked Larry if he would join us in the chat room on Monday periodically thruout the day. He usually comes on approx. 9:15 and gives a voice analysis of where he thinks the market is right now. Also, he'll open it up for a question and answer period. Type in your questions and he'll respond via voice. ( He HATES to type !) You need to check the voice box on the side of the room... he'll do a voice test prior to starting.... Enjoy!!!
I just wanted to let you all know that I asked Larry if he would join us in the chat room on Monday periodically thruout the day. He usually comes on approx. 9:15 and gives a voice analysis of where he thinks the market is right now. Also, he'll open it up for a question and answer period. Type in your questions and he'll respond via voice. ( He HATES to type !) You need to check the voice box on the side of the room... he'll do a voice test prior to starting.... Enjoy!!!
This is from another mentor of mine.... one of Larry P.'s best students....
This is something that should be a permanent part of your trading plan mindset….
“Your last performance does not count. If you won or did the best you possibly could in your last performance, it does not count; let it go. Conversely, if you lost in your last performance, it still does not count. If you try to make up for the previous loss, all you do is create negative thoughts. The past does not exist. The only thing that counts is this performance – where your focus is now.”
Correction on Larry's newsletter in the Grains and Oilseeds...
Grains and Oilseeds
There is a very unusual event occurring in the grains and oil seeds. It just so happens that every member of the grain/oilseed complex is making a gartley or butterfly pattern. NOW!!! Remember that not all patterns work and that everything that we do is based on the probability of a pattern working and not a certainty. This will be interesting to watch it unfold because it is typical of what happens at pattern completion's. Several months ago when the prices of grains and oilseeds were double or even higher the whole world was bullish. Now, the exact opposite has occurred. The bearishness is pervasive thru all of the grains and oilseeds.
This is an ideal trading situation for us!! The reason being is that the risk is going to be very small i.e. $500.00 or less per contract. Any weakness early in the coming week would suggest that these patterns will fail and a small loss should be taken. The profit potential on this trade will be huge (8 to 1 or better) and the probability is better than 75% that this will occur. I will issue an update on the grains and oilseeds via email as I see the pattern either fail or unfold.
You will also be receiving several options strategies for either wheat, corn or beans. We will be looking to buy calls with a $500.00 or less risk.
Also,
I asked Larry if he would come on at 9:00 so as not to conflict with the opening.
I asked Larry if he would come on at 9:00 so as not to conflict with the opening.
The stock market attempted to make new highs again today. In fact, the
NASDAQ was able to make new highs. This presents a potential problem for the
Bears, or a great opportunity. Divergence between similar contracts can be
highly indicative of a major trend change. As you can see from the enclosed
chart, the NASDAQ easily exceeded last week's highs, while at the same time
the S&P 500 (i.e. Dow Jones also) were unable to do so! The bearish case is
still up for grabs. Any move in the S&P 500 above 875 would mean that we are
going higher. The figure for the Dow Jones is 8112. This week will be
critical to what happens going into May 18th which is our next Astro
harmonic date( combust ).
This weekend we will present a comprehensive pattern analysis on all the
major markets as we are approaching some completion of very significant
patterns.
Emini Day Trading /
Daily Notes /
Forecast /
Economic Events /
Search /
Terms and Conditions /
Disclaimer /
Books /
Online Books /
Site Map /
Contact /
Privacy Policy /
Links /
About /
Day Trading Forum /
Investment Calculators /
Pivot Point Calculator /
Market Profile Generator /
Fibonacci Calculator /
Mailing List /
Advertise Here /
Articles /
Financial Terms /
Brokers /
Software /
Holidays /
Stock Split Calendar /
Mortgage Calculator /
Donate
Copyright © 2004-2023, MyPivots. All rights reserved.
Copyright © 2004-2023, MyPivots. All rights reserved.