Larry Pesavento's Insights on the Markets & Charts
Click image for original size
Click image for original size
Robin,
very nice posts. From what little I know...Larry has "got it going on."
BTW, does he still know Ruth?? I would like to chat with her...maybe you can help me.
Your analysis is progressive. And you were correct with the downturn in time and I was not. I should have realized when all the gurus were saying run up till March/April 09...it would not come to pass.
My consolation is my numbers came to pass..and that is better than anyone on Wall Street/Bay Street.
You mentioned about your commodity posts....$500 risk and for options?? You must be good.
G2G
The Point of No Return
One of my most memorable trading days occurred in 1991. Bryce Gilmore, author of "Geometry of Markets," was on one of his frequent visits to my California trading room overlooking the Pacific Ocean. We were watching Treasury Bonds most intently on that day. Bryce was an Austrailian citizen and did not have a commodity account in the USA so he used my account to place orders. On this particular day he told me to sell 10 US Treasury Bonds at $102.00. He then told me to place a buy stop at $102.01. This one tick represented $32.50. I laughed and told Bryce that that was a rediculous place to put a stop because the bid and ask can be one tick and sometimes more. He stood up and as I was setting in my chair he pointed his finger at the monitor and said "if Treasury Bonds go to $102.01 everything I've ever studied about market geometry was worthless and I will take these f...king books out to the pier and throw them into the ocean." Being quite startled I said I think that's kinda of extreme and he reiterated his same statement. About 2 hours after the open which was 8:00 am California time Treasury Bonds hit $102.00. Our order to sell took over 1 hour to fill which meant there was seemingly a lot of supply at $102.00. After 1 hour the total order was filled and I placed the stop on Bryce's order at $102.01 as instructed. Bryce was playing golf that day and was preparing to leave for the golf course and had just placed his clubs in the back seat of his red convertible when bonds quickly dropped 8 ticks which was a profit of $312.50 per contract. I walked out on the balcony and yelled down to Bryce that bonds had dropped 8 ticks and he looked up and said, book the $3,000. I said are you sure, "he said yes, I want to play golf." The reason I remember this all so vividly is because of what happen next. Bryce was driving away from the house and was down at the corner ready to make a left hand turn when I looked at the monitor and TB had just dropped $2,000 per contract. Later that night at dinner Bryce asked me where Bonds closed and my only comment was they were lower than where you got out and I left it at that.
The reason for this trip down memory lane is that we are at that same point in time in the markets. Seldom do we ever see so many patterns coming together with so many ratios at a critical astro harmonic timing point. For example, the Banking Index, the NASDAQ, the S&P cash and futures, the Dow Jones Industrial Average, the Dow Jones Transportation, the Dow Jones Utilities, etc., etc., etc. All of these are at major fib points and pattern completion's. There are a few positive signs; One is that the NASDAQ is at the . 786 and has not made new lows. The Sox Semiconductor Index is still bullish and we are making 600 new lows daily as compared to 1400 new lows daily at our November low.
Frankly, I can never remember seeing so many patterns come together at the same time. The only other time that even comes close to this is in March of 2000 when the NASDAQ was approaching 5,000. The cover of Time Magazine, US News and World Reports and Business Week, all had the same cover. A picture of a Bull with the caption, "NASDAQ 5,000." It never reached 5,000 before dropping 85%.
THIS IS PROBABLY THE EASIEST DECISION A TRADER CAN MAKE IF HE BELIEVES IN PATTERN RECOGNITION! EVERYTHING IS THERE.... PRICE, TIME AND PATTERN. THIS IS WHAT I HAVE SPENT 45 YEARS WORKING TOWARDS. THERE SHOULD BE A GOOD RALLY IN THIS VERY LONG-TERM BEAR MARKET THAT WILL NOT END FOR AT LEAST SEVERAL MORE YEARS. HOWEVER, ( PLEASE READ THIS CAREFULLY) THERE IS STILL A PROBABILITY THAT THESE PATTERNS AND RATIOS WILL FAIL AND WE COULD STILL LITERALLY MELT DOWN IN THE STOCK MARKET. THE DOW RALLIED 200 POINTS NEAR THE CLOSE AND SHOULD NOT TAKE OUT FRIDAYS LOW AT 6460.
Believe me when I tell you that I am extremely nervous which may be good or bad because of the condition of the stock market. My fondest wish is that we get a strong rally lasting from several weeks to several months which would setup a great shorting opportunity. Should the analysis be correct that a rally is ready to occur we should expect the Dow to have one of it's 10 best trading days in it's 200 year history.
I LEAVE YOU WITH THIS FINAL THOUGHT. IF YOU DO NOT PLACE YOUR STOPS BELOW FRIDAYS LOW YOU ARE NOT ONLY RISKING A GREAT DEAL OF CAPITAL YOU ARE VIOLATING ONE OF THE STRONGEST RULES OF MONEY MANAGEMENT, WHICH IS TO PROTECT CAPITOL
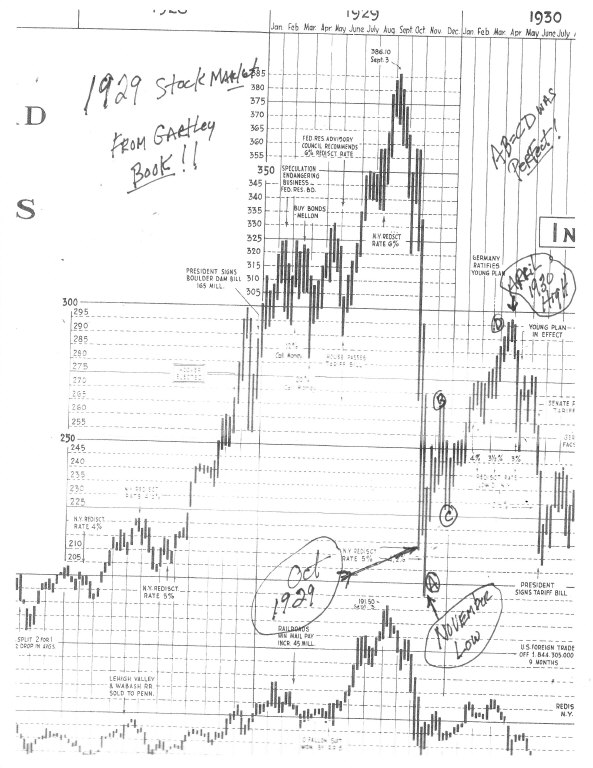
Many of you have asked how this bear market compares to the 1929 to 1932
Great Depression! Enclosed is a chart from the group HM Gartley book that
illustrates the action in the stock market during that time. The great crash
occurred at the end of October 1929 but the low was made a month later in
November. From the November low the stock market rallied almost 60% into
early April of 1930. Following the high in 1930, the stock market dropped
approximately 85%. In September of 1929 the Dow was 383 but by July 1932 the
Dow was 42.
This chart was just for information purposes and no correlation between what
happened then and what is happening now should be made in my opinion.
Current market conditions are is bearish as anyone has ever seen. It is from
these conditions that vicious bear market rallies can start. Even in the
Great Depression there was a perfect AB=CD pattern completing at the April
high in 1930. It would benefit all of us if we keep a close eye on the
patterns that form in the next few weeks or months.
Click image for original size
Larry's charts for this morning...
Click image for original size
Click image for original size
INSIGHT O/N THE MARKETS
From Larry Pesavento
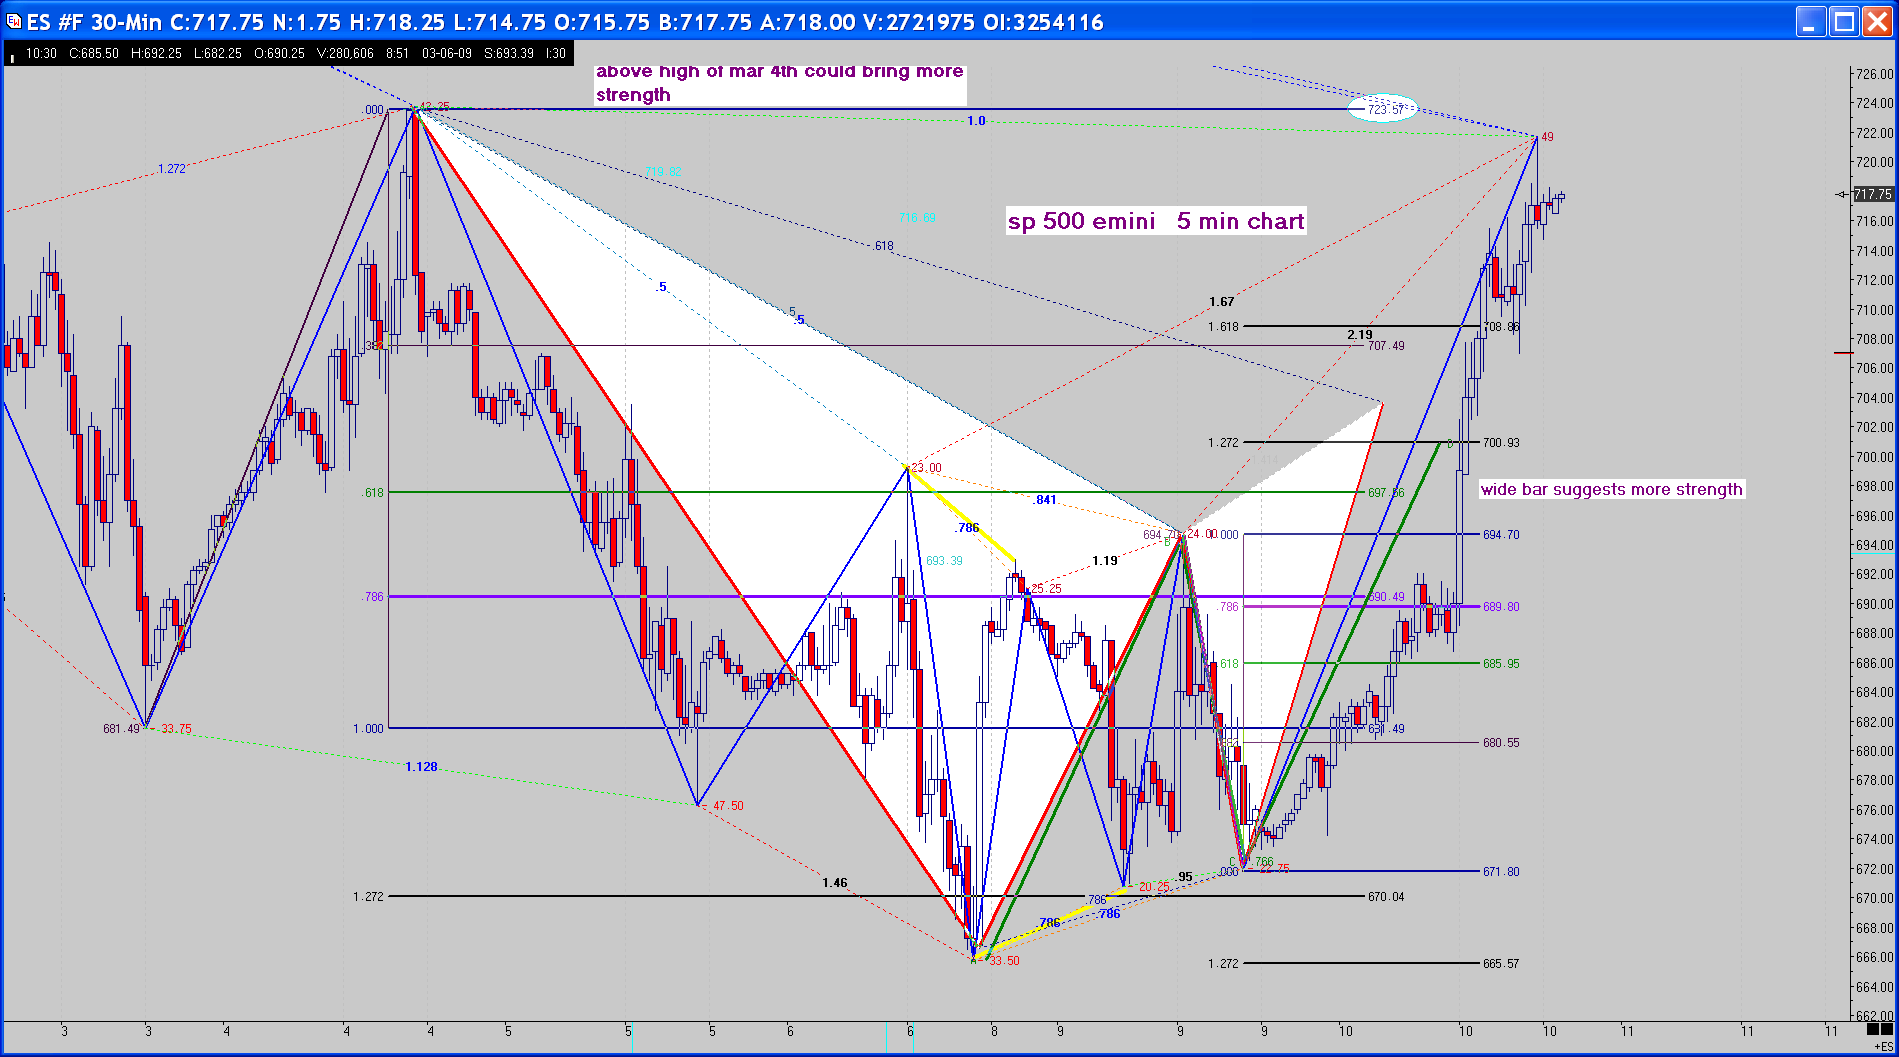
Despite the negative news on General Electric's downgrade in its debt rating stock market was able to manage an 11% rally this past week. Remember that the market is coming off its worst oversold condition in the past 70 years. All the patterns that we have been watching have completed! Bear market rallies can be quite strong and carry farther than most bears can expect. Whether this will be the case this time remains to be seen. This week will give us a lot more technical information to gauge the extent of this rally if it is to continue. Another strong up move in stocks this coming week would be further confirmation that the rally could go on for several weeks or months.
Once the bottom was put in on March 6 both corrections in the S&P 500 have only been 38.2%. Markets that are extremely bullish do not allow traders to enter easily. We should be watching for the first significant AB=CD pattern that forms on the 30 minute chart. Should this occur I will send out a special alert outlining a strategy that might best take advantage of the situation.
Remember that this is still a very long-term bearish market and what we are trying to do is to calculate what this counter trend rally is going to yield over the coming days weeks or months.
Foreign currency
The US dollar index has made a potential double top! There should be strong support at the old breakout level of 85.00. Closing below that level would validate double top pattern. The euro and the British pound have held major support. Japanese yen support is at the 94.00 level
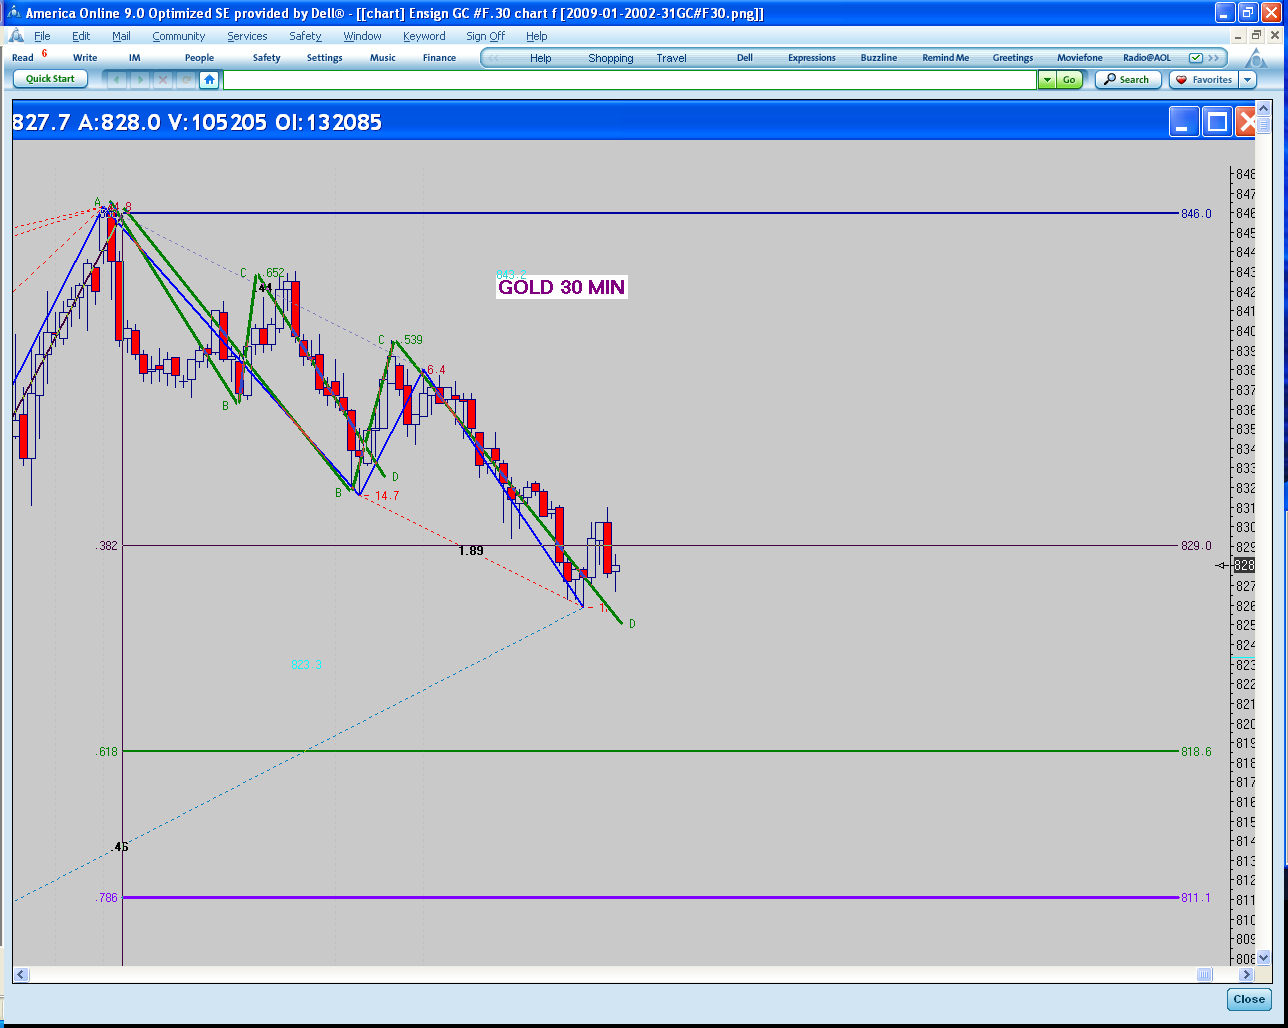
Gold
The yellow metal has held and $900 per ounce level and is now attempting to reach the $960 per ounce level. Going above $960 per ounce would setup a move to well above $1000 per ounce i.e. $1130 per ounce. This week will be very important for gold because it must attack that $960 level very quickly. The reasons behind this are the fact that there is a potential double top at $1000 per ounce and the fact that gold reacted so quickly from that level. The bullish arguments for gold can be based on the fact that the last three corrections have been nearly exactly .618 corrections. These higher bottoms are how a trend is determined.
Treasury bonds
Interest rates have stabilized but credit is still difficult to obtain with the only exception being those with high credit ratings and virtually no debt. Ironically, these are the people that don't need to borrow money. Our views still remains bearish on long-term treasury bonds and any rally to the $131 per level in June bonds would be a good place to consider a short sale. We are constantly watching the price action on treasury bonds to get a low risk Gartley pattern as a sale! These patterns usually take several weeks to form after a major top has been put in like the one in treasury bonds.
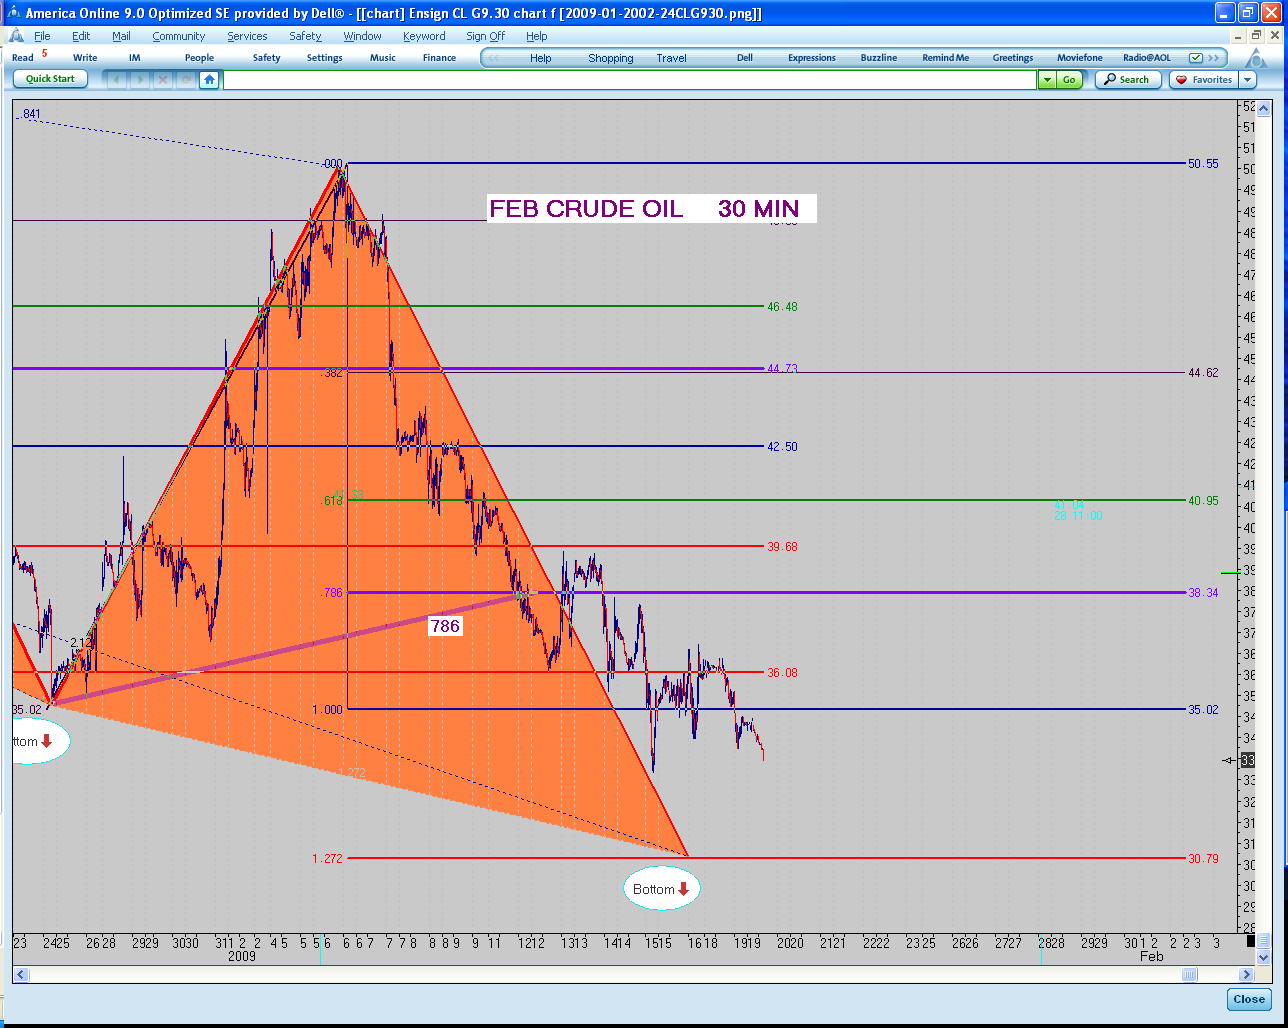
Crude oil
Oil has made a significant bottom at the $34 per barrel level and has been able to rally $12 a barrel over the past few weeks. Our price target of $70 per barrel still appears to be valid. Three major price swings occur at that level 50% ..618 and 1.27 are present at that level as can be seen on the enclosed chart. Any 61% retracement of a low to a high should be considered as a low risk buying opportunity in crude oil in our opinion.
Grains and oilseeds
Corn has been the best performer in the grain and oilseeds market. Corn stopped exactly at the 61% retracement of the last high and should begin the correction if the pattern is correct. This particular pattern is very low risk because any move i.e. $.03-$.05 above the 618 would suggest that corn could be going much higher. Wheat and soybeans have rallied slightly from major support areas but at this time it is unclear as to their direction, in my opinion. Should things change I will alert you with a special e-mail describing the pattern that is forming at that time.
In conclusion, we must not forget that these markets are incredibly volatile and are susceptible to the slightest piece of bad information or negative economic news. History has told us that many times when the market is in fragile condition there can be a further shock such as a war or geophysical event i.e. earthquake, tidal wave etc. This is why stop loss order protection is tantamount to protect Capital and let you trade when the next pattern presents itself
From Larry Pesavento
Despite the negative news on General Electric's downgrade in its debt rating stock market was able to manage an 11% rally this past week. Remember that the market is coming off its worst oversold condition in the past 70 years. All the patterns that we have been watching have completed! Bear market rallies can be quite strong and carry farther than most bears can expect. Whether this will be the case this time remains to be seen. This week will give us a lot more technical information to gauge the extent of this rally if it is to continue. Another strong up move in stocks this coming week would be further confirmation that the rally could go on for several weeks or months.
Once the bottom was put in on March 6 both corrections in the S&P 500 have only been 38.2%. Markets that are extremely bullish do not allow traders to enter easily. We should be watching for the first significant AB=CD pattern that forms on the 30 minute chart. Should this occur I will send out a special alert outlining a strategy that might best take advantage of the situation.
Remember that this is still a very long-term bearish market and what we are trying to do is to calculate what this counter trend rally is going to yield over the coming days weeks or months.
Foreign currency
The US dollar index has made a potential double top! There should be strong support at the old breakout level of 85.00. Closing below that level would validate double top pattern. The euro and the British pound have held major support. Japanese yen support is at the 94.00 level
Gold
The yellow metal has held and $900 per ounce level and is now attempting to reach the $960 per ounce level. Going above $960 per ounce would setup a move to well above $1000 per ounce i.e. $1130 per ounce. This week will be very important for gold because it must attack that $960 level very quickly. The reasons behind this are the fact that there is a potential double top at $1000 per ounce and the fact that gold reacted so quickly from that level. The bullish arguments for gold can be based on the fact that the last three corrections have been nearly exactly .618 corrections. These higher bottoms are how a trend is determined.
Treasury bonds
Interest rates have stabilized but credit is still difficult to obtain with the only exception being those with high credit ratings and virtually no debt. Ironically, these are the people that don't need to borrow money. Our views still remains bearish on long-term treasury bonds and any rally to the $131 per level in June bonds would be a good place to consider a short sale. We are constantly watching the price action on treasury bonds to get a low risk Gartley pattern as a sale! These patterns usually take several weeks to form after a major top has been put in like the one in treasury bonds.
Crude oil
Oil has made a significant bottom at the $34 per barrel level and has been able to rally $12 a barrel over the past few weeks. Our price target of $70 per barrel still appears to be valid. Three major price swings occur at that level 50% ..618 and 1.27 are present at that level as can be seen on the enclosed chart. Any 61% retracement of a low to a high should be considered as a low risk buying opportunity in crude oil in our opinion.
Grains and oilseeds
Corn has been the best performer in the grain and oilseeds market. Corn stopped exactly at the 61% retracement of the last high and should begin the correction if the pattern is correct. This particular pattern is very low risk because any move i.e. $.03-$.05 above the 618 would suggest that corn could be going much higher. Wheat and soybeans have rallied slightly from major support areas but at this time it is unclear as to their direction, in my opinion. Should things change I will alert you with a special e-mail describing the pattern that is forming at that time.
In conclusion, we must not forget that these markets are incredibly volatile and are susceptible to the slightest piece of bad information or negative economic news. History has told us that many times when the market is in fragile condition there can be a further shock such as a war or geophysical event i.e. earthquake, tidal wave etc. This is why stop loss order protection is tantamount to protect Capital and let you trade when the next pattern presents itself
Market update
The markets exploded much to the surprise of nearly all the participants.
Today's action represents an outlier event. Seldom do markets reacted
violently as they did today. Treasury bonds moved 13 points, nine up and
four down in a matter of minutes. It is still too early to tell the
significance of this event but it certainly bears watching. The Federal
Reserve said they were going to buy hundreds of billions of dollars worth of
treasury bonds. I wonder who is going to sell them to them and at what
price.
The action in gold and the weakness of the dollar makes one ponder the value
of paper assets in the long run. Dramatic moves like today scare even the
most experienced trader. One thing is certain if there was ever a day that
one wonders why the use of protective stop loss orders is imperative this
would be today!
Stocks continued their rally making it one of the best rallies since the
spring of 2003. It is our opinion that this rally has farther to go and it
will have its ups and downs but it will be great trading opportunities along
the way.
Stock indices
Thus far the stock market has held the lows of March 6. On March 27 to 30 there will be a triple conjunction of Sun Mercury and Venus! This cycle is known as"combust" and is one of the more accurate for timing stock market turns. However, we must remember that it is only a probability never a certainty. The stocks have rallied approximately 12% or more since the early March bottom. It has been one of the strongest rallies on record. We have to go back to 1937 to find a rally of this magnitude. We still believe that we are in a bear market and are experiencing a very strong countertrend rally.
Resistance this week occurred at the exact Fibonacci retracement's of the previous high. For example, the 800 level in the S&P 500 is strong resistance being at the 618 of the previous high. Once this resistance is taken out by higher prices it is our opinion that the market will move substantially higher. Keep in mind that these swings will be very volatile and the market will try to trick as many participants as it possibly can. Pattern recognition is as close to a science as anything available in the stock market. The patterns we use will keep us out of trouble and hopefully keep us on the right side of the market.
Treasury Bonds
The announcement by the Federal Reserve Board that they were going to start buying U.S. Treasury bonds in order to put cash into the system to make it available to stimulate the economy caused treasury bonds to rally strongly this week. It was the largest single up day, or any day for that matter, that has ever occurred in the 33 year history of treasury bond trading. On that day I can assure you that many traders not using a stop were wiped out, with some also facing bankruptcy. The question that I keep asking myself is that if the Federal Reserve is going to be buying treasury bonds who in their right mind would be willing to buy these bonds. 30 year treasury bonds are very susceptible to inflation. With the treasury printing money to pay for all the bailouts and economic stimulus programs is going to be just a matter of time before inflation will raise its head. The problem is that people are maxed out with their credit and have very little buying power. Once unemployment increases at a faster pace most of these folks will not be able to pay their credit card debt or their mortgages. This is probably one of the reasons that bank stocks have dropped so much because they know that the credit card income will soon turn around and become a liability.
Gold
Gold was very exciting to watch this week as it made the 618 retracement on the downside and on the same day made the 618 retracement on the upside, the downside 618 was 882 per ounce in the upside retracement was 963 per ounce. Gold will need to exceed either of these two numbers in order to move to the next target. Keep in mind that there is a potential that gold has made a double top at the 1000 per ounce level! It is still too early to tell if this is the case but it bears watching.
Foreign currency
The Forex market reacted violently this week with the euro rallying 500 pips in a matter of hours. All currencies were extremely volatile. Forex markets are cash driven markets meaning that it is money being moved from one country to another to try to take advantage of interest rates differentials and perceived strengths or weaknesses.
The US dollar has potentially put in a double top on the daily charts going back to last 6 to 10 months. It is still in a bear market and would have to exceed the 95 level in order for that trend to change.
Crude oil
This market has surprised many financial experts by rising above the $50 per barrel level. It was just a few short weeks ago that oil was trading at $33 per barrel with forecasts of $20 per barrel being bantered around the financial channels on a daily basis. As you can see from the enclosed chart the most logical target would be the 1.618 expansion of the last swing which would take oil to the $70 per barrel level. Should we get a 61% retracement of the current rally we would watch very closely for a buy pattern in the traditional Gartley manner.
Grains and oilseeds
Currently these markets have reached some resistance after rallying off of the recent lows which were also very strong support levels at the 786 Fibonacci retracement. This week's highs were also Fibonacci retracement level at 618 or 786 level. These patterns are very similar to what occurred in the gold market. We remain bullish on the grains and oilseeds but would like to buy them on weakness rather than strength.
In summary
March 30 will mark a very important cycle point. It could be a cycle high or a cycle low. No one knows what the hundred percent certainty. What we do know is that the probability is present and we are waiting for a pattern completion to determine whether this low i.e. or high will come in as expected! Fortunately, we can send out e-mail alerts to take advantage of some of these patterns should they unfold as they have in the past. If there is one lesson to be learned this week it would have to be in the treasury bond market. Not using a stop could have caused irreparable damage to traders that were short. One of the best lessons I ever learned from my good friend Mark Douglas author of "Trading in the zone"was this. If you don't use a stop you are telling the market that you know with 100% certainty that you know where it is going and it is unnecessary to protect yourself against the" unthinkable" happening! Stops are there for your protection and they must be used at all times.
quote:
Originally posted by rfarina187
Good Mark Douglas interview
http://www.viddler.com/explore/killbliss/videos/3/
Thanks for posting this
The stock market attempted to make new highs again today. In fact, the
NASDAQ was able to make new highs. This presents a potential problem for the
Bears, or a great opportunity. Divergence between similar contracts can be
highly indicative of a major trend change. As you can see from the enclosed
chart, the NASDAQ easily exceeded last week's highs, while at the same time
the S&P 500 (i.e. Dow Jones also) were unable to do so! The bearish case is
still up for grabs. Any move in the S&P 500 above 875 would mean that we are
going higher. The figure for the Dow Jones is 8112. This week will be
critical to what happens going into May 18th which is our next Astro
harmonic date( combust ).
This weekend we will present a comprehensive pattern analysis on all the
major markets as we are approaching some completion of very significant
patterns.
Emini Day Trading /
Daily Notes /
Forecast /
Economic Events /
Search /
Terms and Conditions /
Disclaimer /
Books /
Online Books /
Site Map /
Contact /
Privacy Policy /
Links /
About /
Day Trading Forum /
Investment Calculators /
Pivot Point Calculator /
Market Profile Generator /
Fibonacci Calculator /
Mailing List /
Advertise Here /
Articles /
Financial Terms /
Brokers /
Software /
Holidays /
Stock Split Calendar /
Mortgage Calculator /
Donate
Copyright © 2004-2023, MyPivots. All rights reserved.
Copyright © 2004-2023, MyPivots. All rights reserved.