Larry Pesavento's Insights on the Markets & Charts
Click image for original size
Click image for original size
Robin,
Jan 28 is a REVERSAL DAY. Sometimes these come 1 day after or before. But you have to see how the day before went to judge.
Jan 27 was as I predicted sideways, so Jan 28 should be up day. This may start during globex.
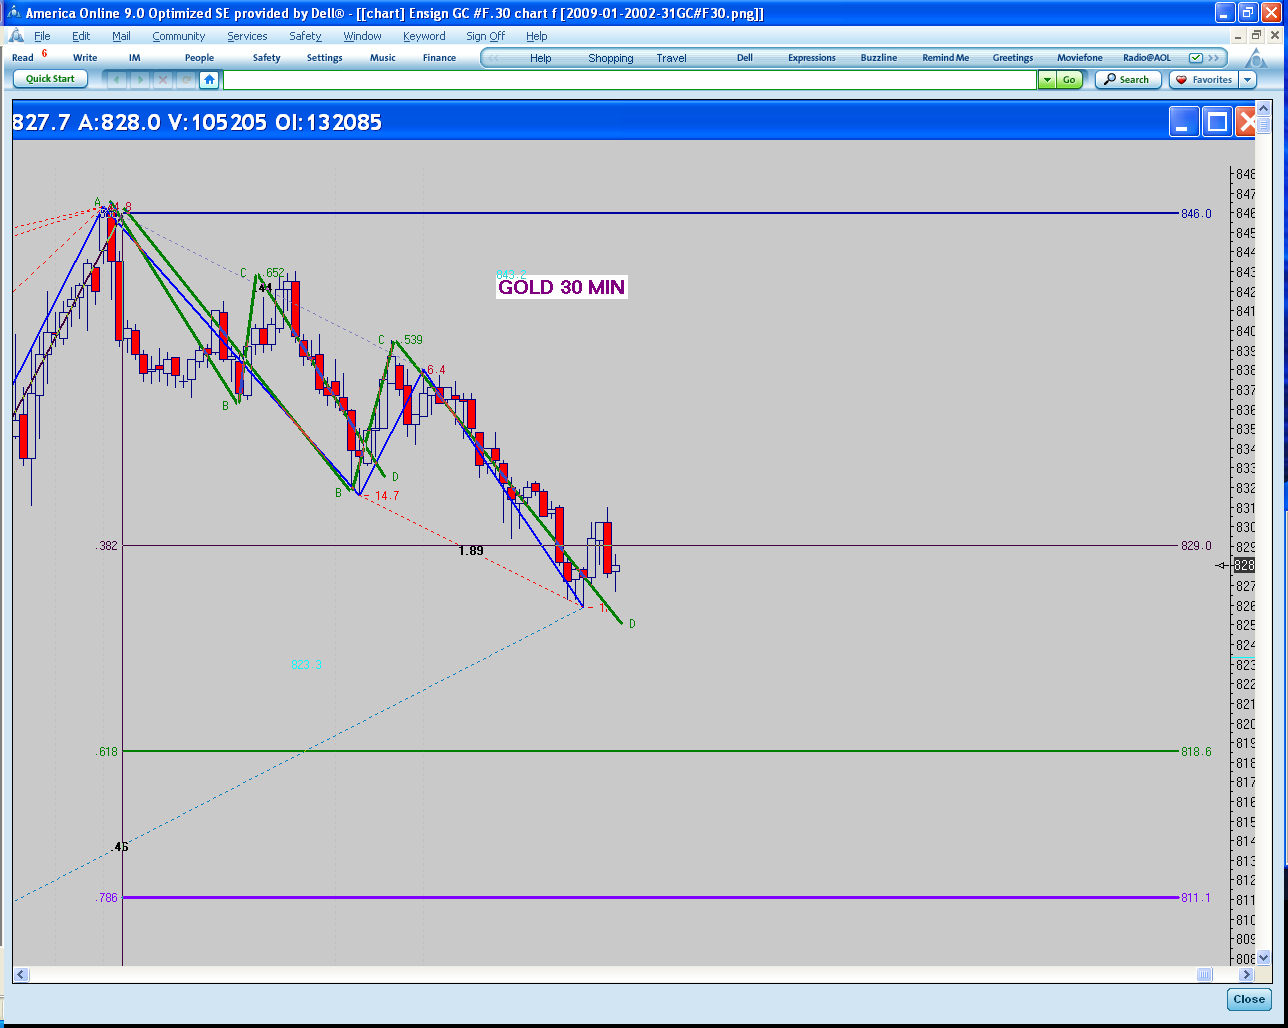
As long as above 829 going up and above 842.25 for Jan 27 up move definetly up. I am expecting 871-881.25 as highs as my guess this week was up. Precisely 881.75. So the highs should settle in 871-881.75 area this week if I'm right.
Hopefully a nice cup and handle on globex. My upside came true last week and I had 2nd downside was 799.25. The main one was 776-783 area and that did not come to pass.
Macro picture, If I'm right then we should slowly move up and the areas of interest would be above 1008 so 1088 to 1163. This should be final up move area...if it gets there then we see Arpil and April FOOL's Day(s).
Now, I could be wrong for this week and overall.
Other reversal days...FEb 3, 13, 20, 26, Mar 4, 10, 16,20,26, Apr 1, 7, 14, 20!!!
Watch the day before and see how it plays out with the pivots.
Very nice daytrading. My motto is too many cooks can spoil the "Broth." But to each his/her own.
Jan 28 is a REVERSAL DAY. Sometimes these come 1 day after or before. But you have to see how the day before went to judge.
Jan 27 was as I predicted sideways, so Jan 28 should be up day. This may start during globex.
As long as above 829 going up and above 842.25 for Jan 27 up move definetly up. I am expecting 871-881.25 as highs as my guess this week was up. Precisely 881.75. So the highs should settle in 871-881.75 area this week if I'm right.
Hopefully a nice cup and handle on globex. My upside came true last week and I had 2nd downside was 799.25. The main one was 776-783 area and that did not come to pass.
Macro picture, If I'm right then we should slowly move up and the areas of interest would be above 1008 so 1088 to 1163. This should be final up move area...if it gets there then we see Arpil and April FOOL's Day(s).
Now, I could be wrong for this week and overall.
Other reversal days...FEb 3, 13, 20, 26, Mar 4, 10, 16,20,26, Apr 1, 7, 14, 20!!!
Watch the day before and see how it plays out with the pivots.
Very nice daytrading. My motto is too many cooks can spoil the "Broth." But to each his/her own.
Click image for original size
Click image for original size

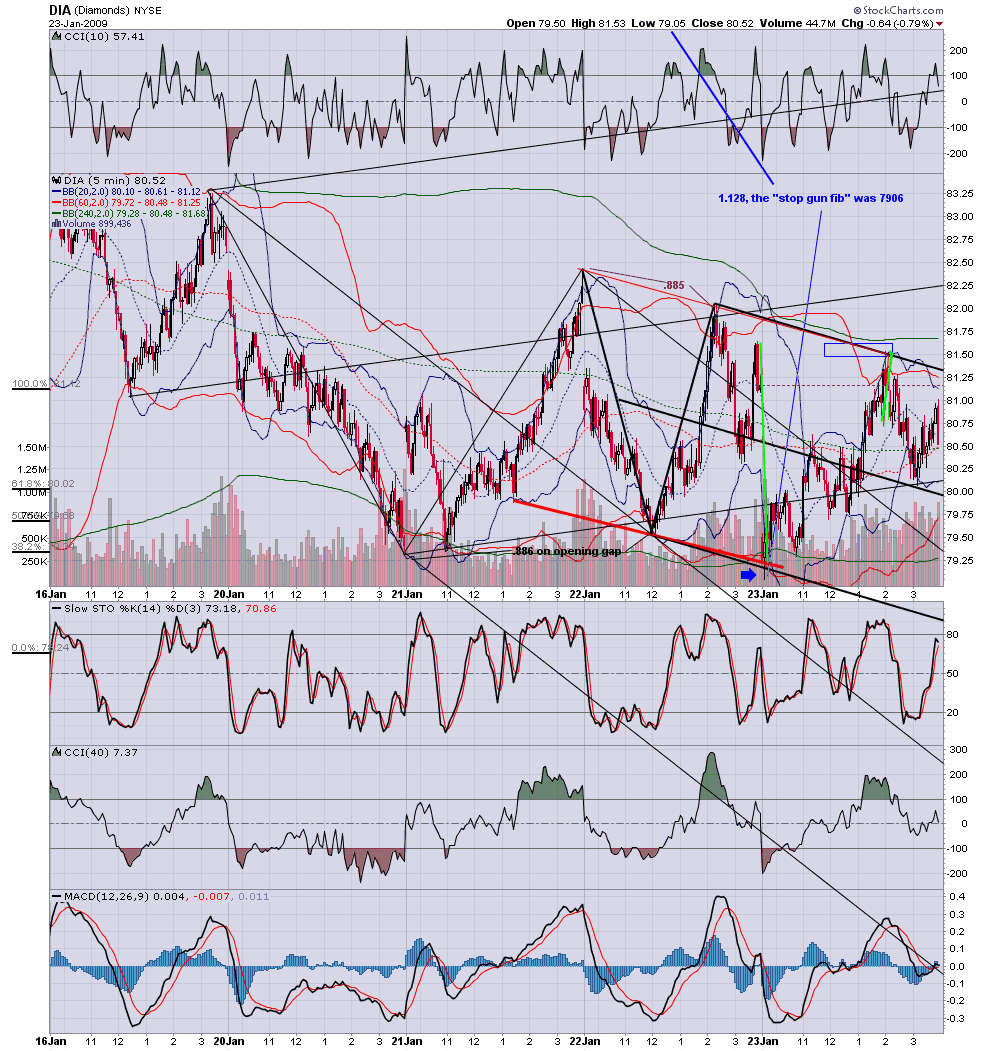
daytrading- i know exactly what you mean about ''cluster'' my charts are setup to show me when different groups using different tools are looking to turn price at the same time.what i find funny is that often these different groups express disdain for the others technique.....pips if you are looking for a number or a trade.. check out my post on .886.. and if you or another trader will do me the humorous honor of suggesting that i am just a worthless degenerate slug only intent on selling kane products( as has happened here before) i will show you a trade setup that will change forever the way you look at opening gaps .
Hey Roofer, I've been lacking some sleep but I'll do you that favor.....you " worthless degenertareate".....I personally don't believe you are but since you asked.........LOL...perhaps you can get us a link to the .86 as that is not a very common fib and many I think would benefit from it.....For me I'd like to know more of how you play opening gaps as I have been caught in my share of bad gap trades in the ES..........
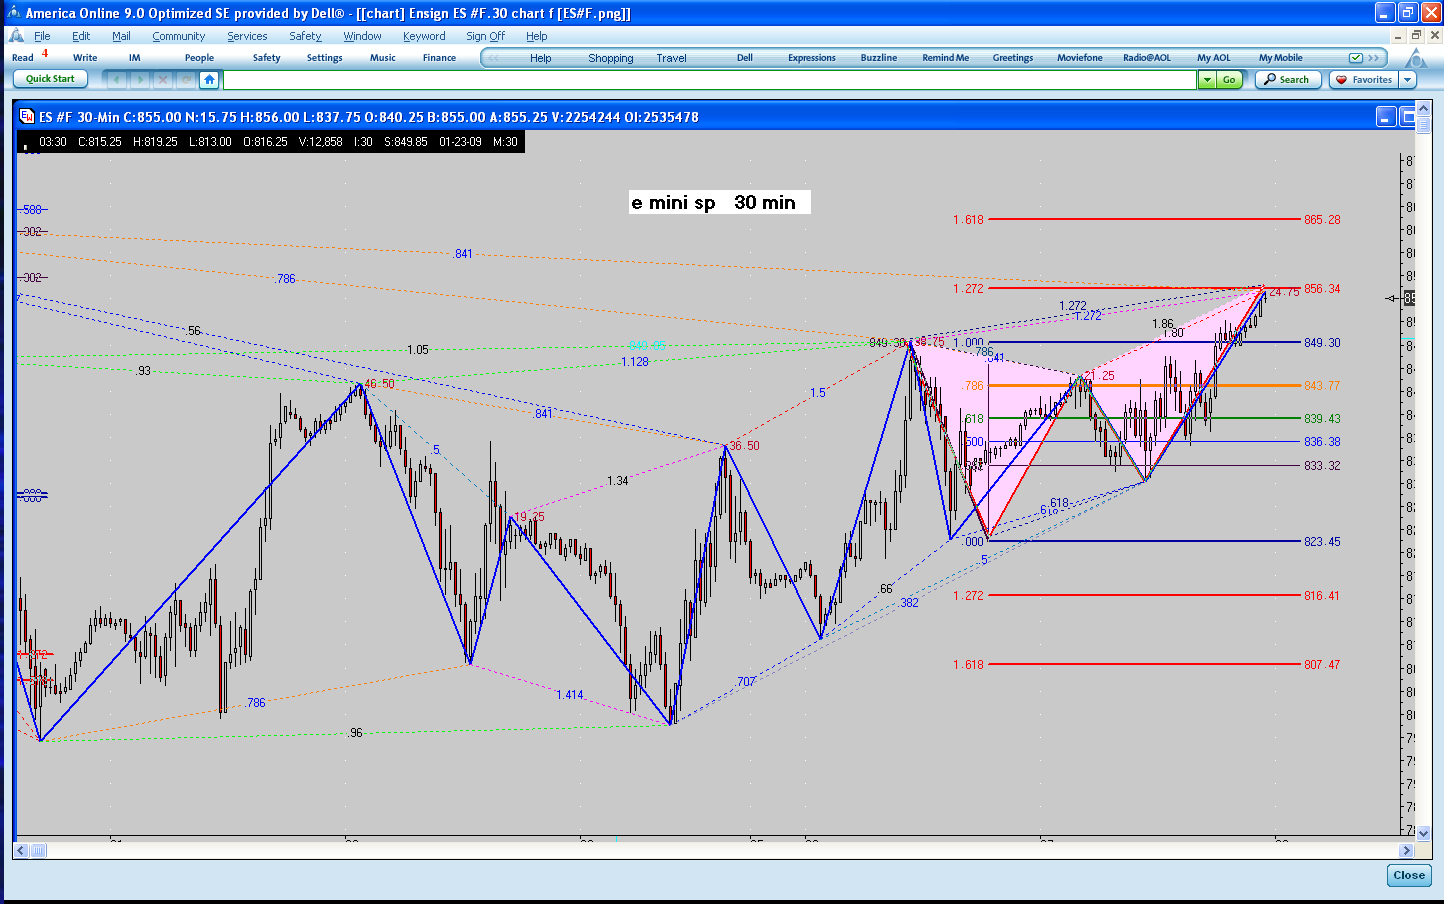
I agree with your comments that we need to see what everyone is up to and not just fibs or MP or pivots etc...we need a wholistic approach these days........For example we have the 1005 high in the ES and the 739 low....so we can get the old 50% level ( like pips) and then bring in some key MP levels and then we may start to have a better zone.......just a quick example....
Ok, So I've done you your favor.......I gotta prop some toothpicks up into my eyelids to hold them up so I can possible trade today....
Folks who are new to the kane work would do well do check out the site...lots of free stuff there
bruce- thankyou for your reply.. later this evening i will post trade with recent examples to show how frequently the trade gets hit...
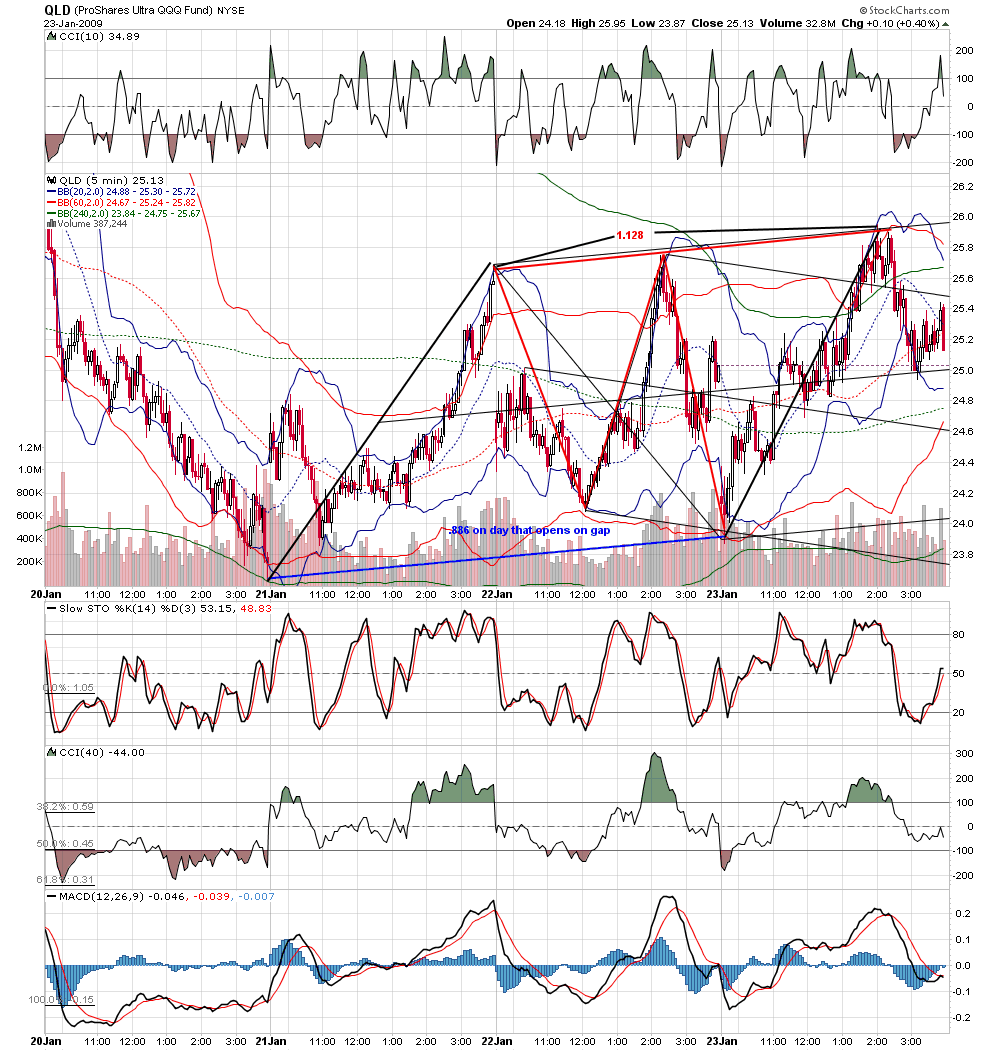
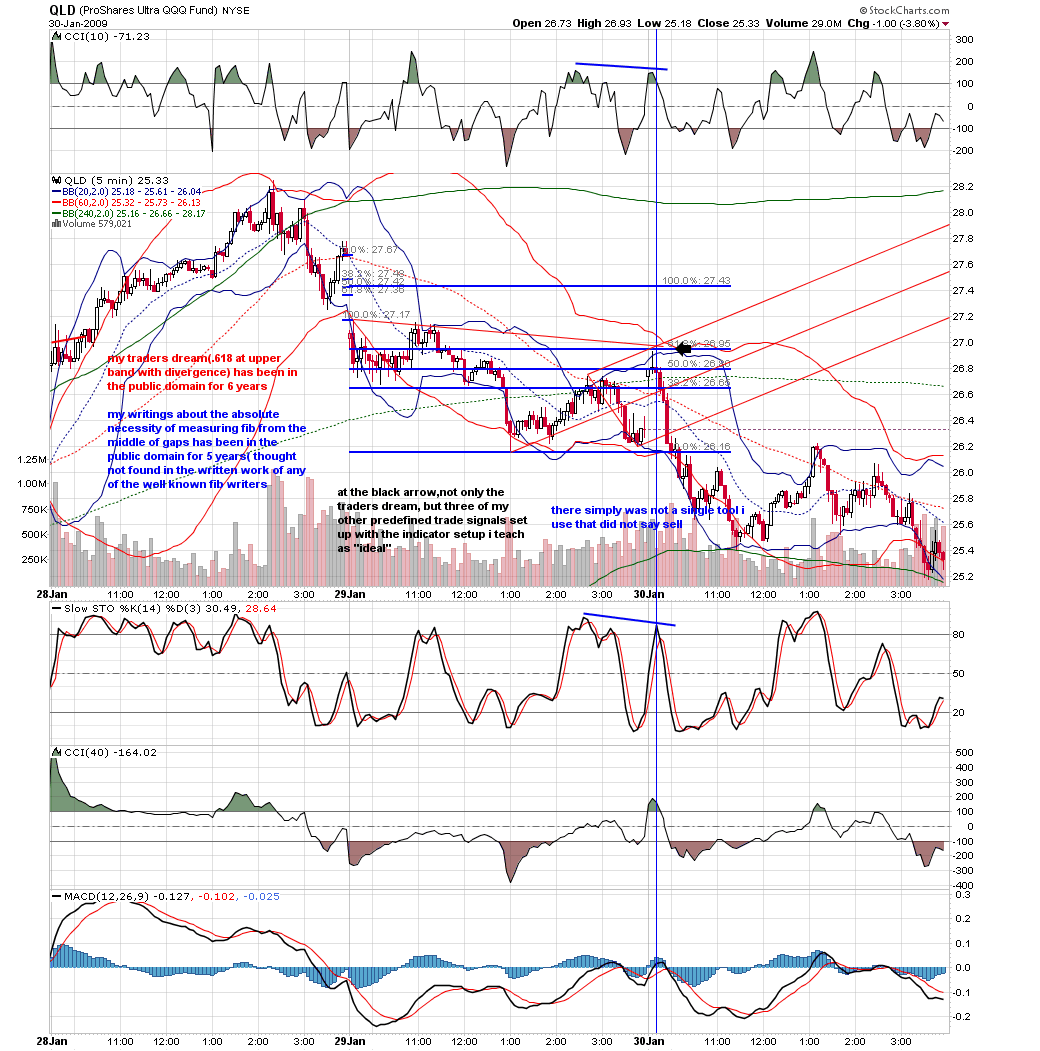
i am tired too so i will make it brief..on days that open on a gap, the .886 become the focus of skilled fib traders who look to trade it in conjunction with their other tools... they do not trade it blindly... but they know to pay close attention...i am a medianline trader . the ideal setup therfor for me in when price opens on a gap and then price trades to the .886 at the same time it is at an important line.. the advantage of trading medianlines is that you simply measure to the next line divide by five and get your stop that is always 1/5th your target
Click image for original size
Click image for original size
Click image for original size

Click image for original size
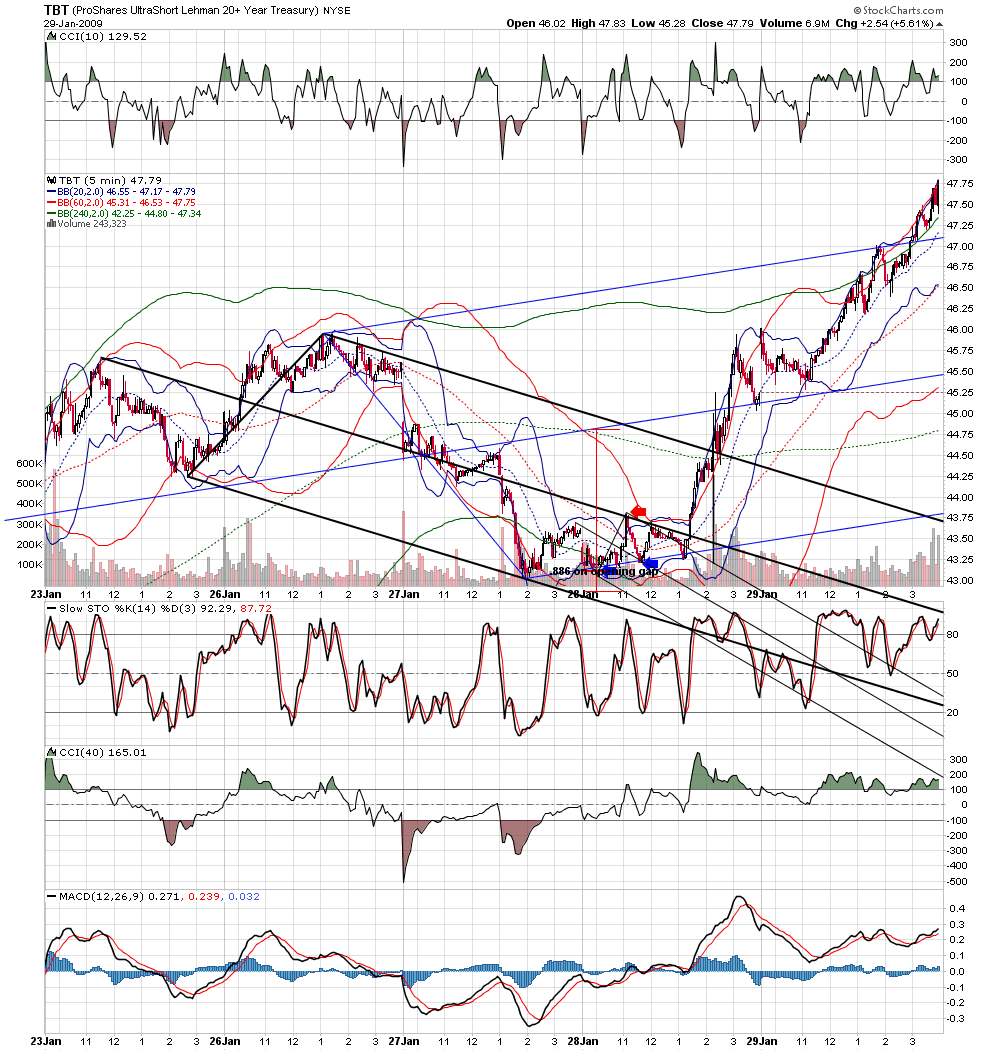
. over the last two years i have posted hundreds of examples of this trade at jim's forum as have other traders who find it useful... the skf traders and uyg traders have started ''jumping'' the trade by trading the .885... and so i adjust...the violin headings were in response to traders who were lost in the action... i simply said the skilled numbers traders were playing the market like a fine violin.the tbt example shows a frequent result of a seemingly minor .886 on opening gap... a large move....the .886 on opening gap is a PREDEFINED trade signal.. i have collection of twelve... some with silly names like theBLT sandwich, thelightning trade,the traders dream,the double barrel shotgun. i trade them with confidence because i know them so well.
the answer is yes...traders from all time frames sit on the trade
Click image for original size
Click image for original size
pips said'' give me a number i can use''every self respecting fib trader knows this game that is played on trend days.. buy the .382 of a previous swing at lower band of bb20 with sto below 20 and divergence on macd... sell 1.27 of swing...it is rare on trend day that you do not get at least 3 of these.
Click image for original size
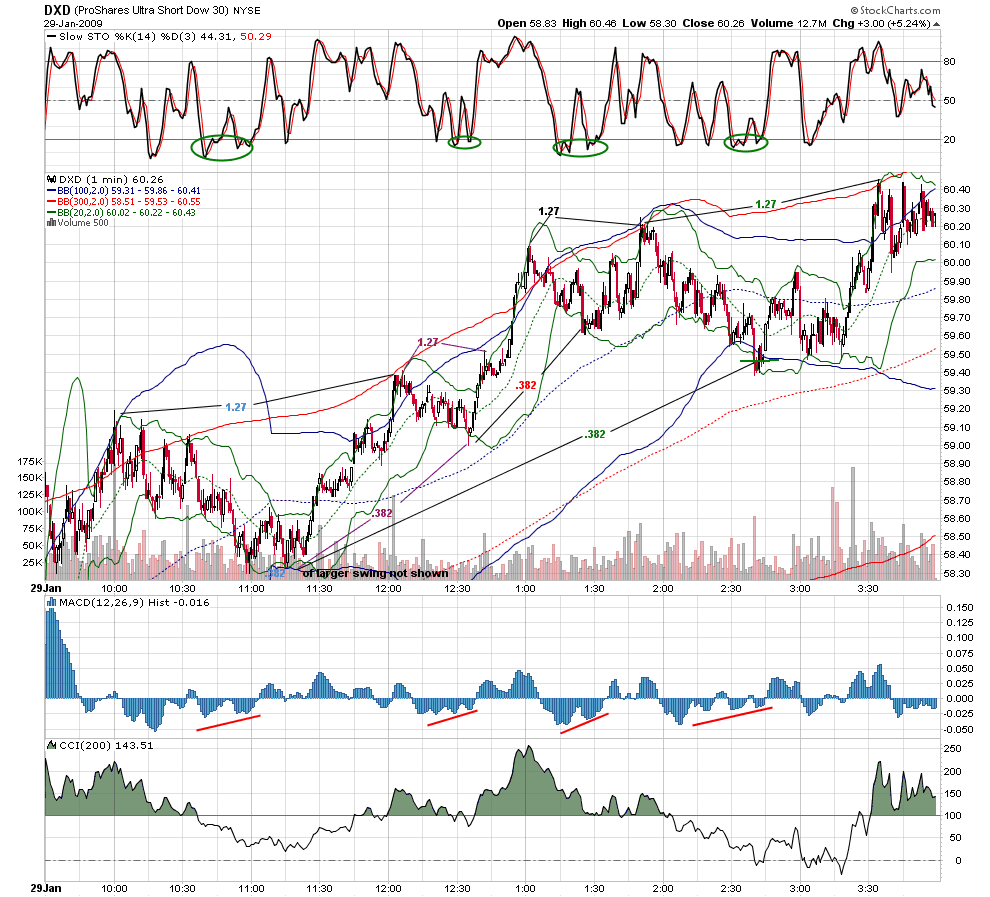
the irony is not lost on me that i am showing powerful techniques that skilled fib traders use every day that are not even mentioned in pesavento's work or even considered by people who are ''experts'' in teaching fib.bottom line... fib is being traded skillfully every day in the market... just not in the way most people think.. i thought i would give my fellow traders a glimpse.
Click image for original size
Click image for original size
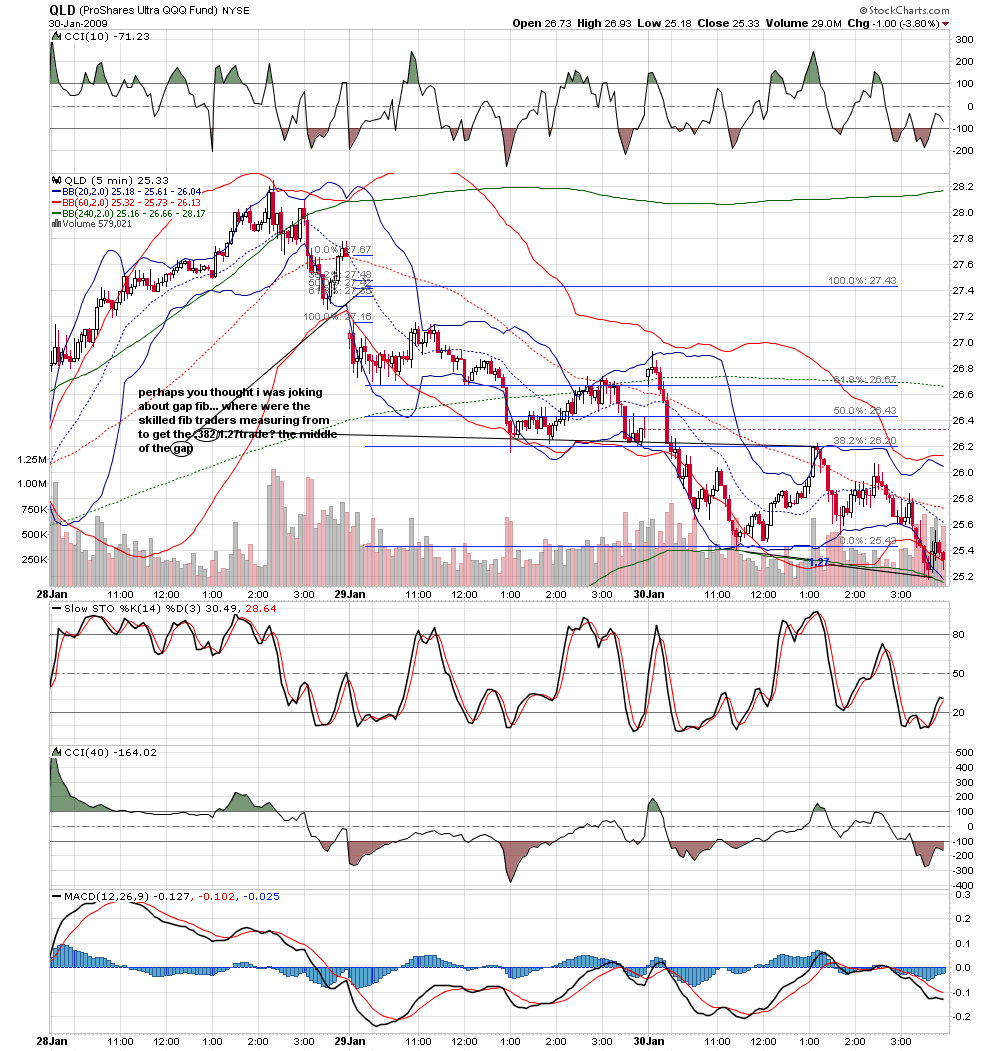
it seems very selective and over optimized as an after the fact example......to me ( the untrained fib eye) it seems nothing more than a retest of the previous days (January 29th) low......easier to spot than all the lines but as long as it works for you that's what counts.....it also looks like a 50% test of the January 30th range too....seems like a simple one without using any gap from a previous day
The stock market attempted to make new highs again today. In fact, the
NASDAQ was able to make new highs. This presents a potential problem for the
Bears, or a great opportunity. Divergence between similar contracts can be
highly indicative of a major trend change. As you can see from the enclosed
chart, the NASDAQ easily exceeded last week's highs, while at the same time
the S&P 500 (i.e. Dow Jones also) were unable to do so! The bearish case is
still up for grabs. Any move in the S&P 500 above 875 would mean that we are
going higher. The figure for the Dow Jones is 8112. This week will be
critical to what happens going into May 18th which is our next Astro
harmonic date( combust ).
This weekend we will present a comprehensive pattern analysis on all the
major markets as we are approaching some completion of very significant
patterns.
Emini Day Trading /
Daily Notes /
Forecast /
Economic Events /
Search /
Terms and Conditions /
Disclaimer /
Books /
Online Books /
Site Map /
Contact /
Privacy Policy /
Links /
About /
Day Trading Forum /
Investment Calculators /
Pivot Point Calculator /
Market Profile Generator /
Fibonacci Calculator /
Mailing List /
Advertise Here /
Articles /
Financial Terms /
Brokers /
Software /
Holidays /
Stock Split Calendar /
Mortgage Calculator /
Donate
Copyright © 2004-2023, MyPivots. All rights reserved.
Copyright © 2004-2023, MyPivots. All rights reserved.