quote:
Originally posted by jimkane
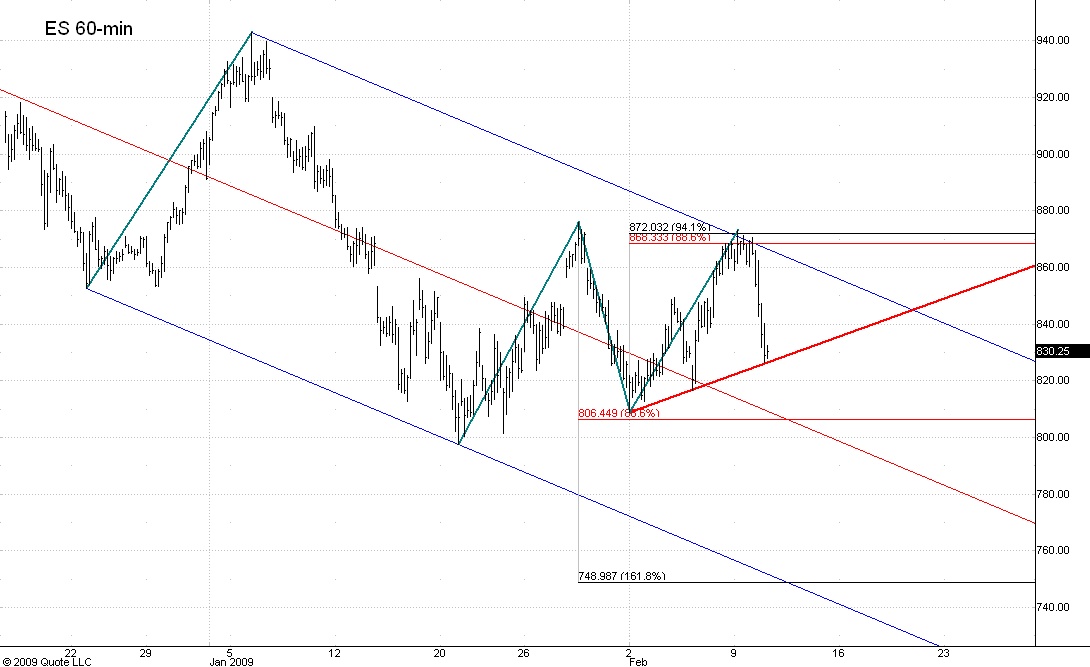
Now, we are getting to a good area for a bounce to start. It is also a good swing trigger area for the entire up move (assuming a potential trade for a move to new low, if one felt that was a reasonable premise). The point is, this may start to move up here, and either continue the uptrend to new highs, or stop short and put in a lower high, and initial 'wave 2' move. This can then be used as a possible second entry for the short side, or as a swing trigger point if it then rolls down, for those that want a lot of confirmation. It's also possible that it doesn't bounce in here to any significant degree, and if one isn't in already, an entry for a bigger move would be tough.
Just tossing out some ideas as this starts to unfold, as to what I am watching and how I am seeing the potential scenarios. Just keep in mind this 770 area was perhaps the best area of all of them, being the exact comparison move with the 4-point (look at the Russell, and its reaction to the same setup), and that ISEE Index. So, I'm taking this very seriously, and it sure did 'see it'. The really cool part is how the price action, I think, will speak loud and clear. If it bounces, it should act a certain way if it plans to roll right back down and continue lower. If it plans to just go right back to the uptrend, it will act certain ways. It should become clear which way it is acting fairly quickly. The really 'trick', in my opinion, is to read the clues, and not interpret them based on if you are still riding longs or have a newly initiated short. Read the clues without the bias of what you want to happen, and then act accordingly. That a big step to maturity as a trader, IMO. From Reminiscences of a Stock Operator: 'I own stocks because I am bullish, I'm not bullish because I own stocks.' The clues are the clues.
So, the clues were as clear as crystal to me, and this was a quintessential example for everyone as far as reading of price action. Here's some thoughts, and you can see how you looked at things at these points, and see how you may have differed. Given the critical area we dropped down to at the open, I already suspected the down move was over and we would be headed to new highs. But, I wanted to stay with the assumption that that 770 area might send us to new lows until the clues told me otherwise.
So, we bounce up, put in an almost-flat ABCD, and then go up to complete a sweet-looking ABCD with that almost-flat in the BC leg at the daily pivot, VAL, and the GLOBEX high, at a .486 off the top. I had a set line dead in there. How nice can it get? It rolls right off the area, and gets to just about the exact spot that I don't want to see it start up from. And what does it do? It starts up.
This is fine, but I know where it needs to roll from, or the action is all wrong. It goes to that area and ignores it. My last chance, if I give it that much, is the .786 stop from
Trade Management, initiated because the first thrust area was hit near perfectly. It goes almost two ticks through that, rolls a little, and then launches like it has a rocket up its a#%. Clear, clear, clear signals one after another. This is going to be a trend up day, setting news highs. The clues are talking.
But, you say, maybe this is one of those strange but allowed under Elliott 3-wave AB legs, and that pullback there was 'wave 2' (unstructured?), or maybe even a poorly formed TD ABCD for 'wave 2', and a bigger ABCD completes up higher. Well, that might be. That area completes around 64, right at the POC and another line. It goes there, starts to roll, does a smalll little ABCD, and launches up. It's over, no doubt in my mind the bias is up, strongly. New highs coming. 770 was nice while it lasted, but not today.
Now, while one could make the latter arguments, I think it was clear early on, and that persisting short side not only would lead to stopouts, but to some very nice long trade opportunities being missed. If one was holding puts off that 770 area I could see that affecting his or her judgement in long side setups for intraday mini trading. The clues are the clues, and they rarely speak louder than the last few days, in my experience. I hope this helps everyone in seeing how I may look at things.