Looking to sell ?
This 1047 - 1050 area..lots of volume firing off up here....good day for a gap fill...
what a frustrating day!
22 years ago today, to the day, I was working in Toronto as a broker.
Monday 19 Oct 1987.
The market started falling. A big day was 10 points and 30 a huge day. the screens were only programmed to show 2 digits. when it got past 99 we didn't know if it was minus -137 or minus -237.
Amazing.
Nothing to be done. No bids and no circuit breakers - by Wednesday the fall had completed but the clients didn't come back. I was a new broker and after trying to hack it for another 1.5years I gave up.
I thing like that leaves an impression.
Black Monday.
and now 19 Oct 2009 is also a Monday.
ooh-oo-ohh-oo (that's supposed to be Outer Limits music :-)
quote:
Originally posted by blue
Hi MM,
I can't find that gap. Where did you see it?
http://finance.yahoo.com/q/hp?s=^GSPC&a=09&b=3&c=2008&d=09&e=30&f=2008&g=d
tried to upload screen snap of my ES08 data - but no go.
mercury retro?
Hey Blue,
Took a peek at the web link you posted. It shows a gap down on Monday Oct 6 with its high of 1097.56 being lower than the previous trading day's low on Friday Oct 3 of 1098.14
I think that's the actual SP-500 cash index (?). The SP emini contract ESZ8 for Dec 08 using RTH shows a gap down on my TS charts (TS symbol ESZ08.D) ... barchart.com shows the low of Oct 3 as 1102.50 but won't show the gap since they include all trading (beyond RTH):
http://charts3.barchart.com/chart.asp?sym=esz8&data=A&jav=adv&vol=Y&divd=Y&evnt=adv&grid=Y&code=BSTK&org=stk&fix=
Any ES "continuous contract" chart will also show a gap if using RTH, but it will be a different (lower) price due to the the nature of cobbling together the different contract months over time. I'm sure I'm blathering on about what you already know.
Anyway, here's a daily ES chart of the Dec 08 contract out of TradeStation:
Click image for original size

At least this is what I'm seeing ... let me know if my head's not screwed on straight. This is the gap price to close, 1102.50, I'm thinking folks will be looking at vs. the continuous contract gap price.
Thanks MM,
I'm so tired today I guess I can't see straight!
Thanks for checking and for the graph.
My data (collected by hand with errors included for free :-)
confirms the gap you highlighted.
I'm so tired today I guess I can't see straight!
Thanks for checking and for the graph.
My data (collected by hand with errors included for free :-)
confirms the gap you highlighted.
Click image for original size
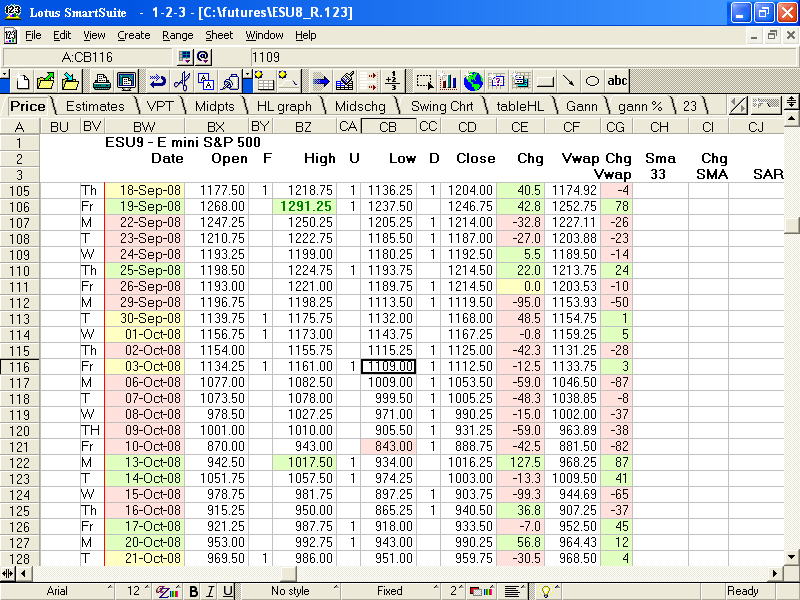
I'll keep an eye out for 1102.5 tomorrow!
thanks guys ..I'm watching 1097 and that 1090 both atracted lots of volume yesterday and the overnight has messed with them both too......still like the short side ( a broken record) up at 1097 and eventually I'll get the big move...which for me will be a minus 8- 10 number.....alays a clue for me is to watch and see what happens if we hit a plus or minus 4 or the inability to reach one and a trade back through the opening high or low...best as usual in the first hour...good luck today
Good info, as usual, for laying out a map for the day Bruce. You've got me watching the open plus/minus 4 and 8-10 these days. Will keep an eye on globex high ... 1199 so far pre mkt. Watching that area I mentioned a few posts back ... more like the 1199-1202.50 zone as significant. I'm still treating this as a bull mkt with primarily long daytrades. How price reacts to this area could change that. It depends on how quickly and persistent the buyers and larger prints on the offer come in. Have 1090-1088 as initial support. 1076-1077 would seem the next really significant support area (so there's room to the downside to there if we do get sellers coming in). Just what I'm looking at so far today.
Was a buyer at 1090 for a scalp on the way back up after test of 1090-1088 where selling dried up ... looking at 1093 now and if mkt can get above it and hold that level, would anticipate a move (at some point) up into at least the 1097 area and would be likely looking for a place to get long not too far above the 1093 ... gotta get above there and hold first. Break of earlier morning low instead, negates that.
I would have expected them to get it back to the opening print after a minus 4 is traded to but since that didn't happen I still favor the shorts.......they need to break an hour range to fulfill the next set of probabilities....
edit: the natural conflict lies in the fact that they usually will break a RTH range too.....so do we trade for a 60 minute break or a RTH break ......perhaps both is the best way to go as MM said with a long bias and go for the 60 and RTH breaks...sidelined right now
edit: the natural conflict lies in the fact that they usually will break a RTH range too.....so do we trade for a 60 minute break or a RTH break ......perhaps both is the best way to go as MM said with a long bias and go for the 60 and RTH breaks...sidelined right now
anyone have access to probabilities that can tell us how often we break a 60 minute low but then go and break the previous days RTH highs......? Now that would be a useful study....or how often we break the 60 minute high but take out the prevoius days RTH low......
as long as we don't overtake 87.50 again they should try for that volume at 77.50...tricky stuff sometimes but we know that volume attracts price, tough part is fiquring out which volume will be the strongest attractor
I SAID A DAY GO IF 1033 DOESNT HOLD WE'LL LIKELY GET A TEST OF 1018-19.50.. STILL FEEL THAT WAY
Emini Day Trading /
Daily Notes /
Forecast /
Economic Events /
Search /
Terms and Conditions /
Disclaimer /
Books /
Online Books /
Site Map /
Contact /
Privacy Policy /
Links /
About /
Day Trading Forum /
Investment Calculators /
Pivot Point Calculator /
Market Profile Generator /
Fibonacci Calculator /
Mailing List /
Advertise Here /
Articles /
Financial Terms /
Brokers /
Software /
Holidays /
Stock Split Calendar /
Mortgage Calculator /
Donate
Copyright © 2004-2023, MyPivots. All rights reserved.
Copyright © 2004-2023, MyPivots. All rights reserved.