Looking to sell ?
This 1047 - 1050 area..lots of volume firing off up here....good day for a gap fill...
"P" pattern and lots of air off the 81 key number..trading for a 81 retest up here at 87...
biggest volume at 85.50 so that is the price to beat for us short runners to win
challenge is that we know they want an hour high or low and a previous days high or low....I'm not thrilled with this short idea as I have conflicts...open drive above VAL and open implies buying impulse....gotta bust that 85.50 or else they will go for that hour high and fridays high.....
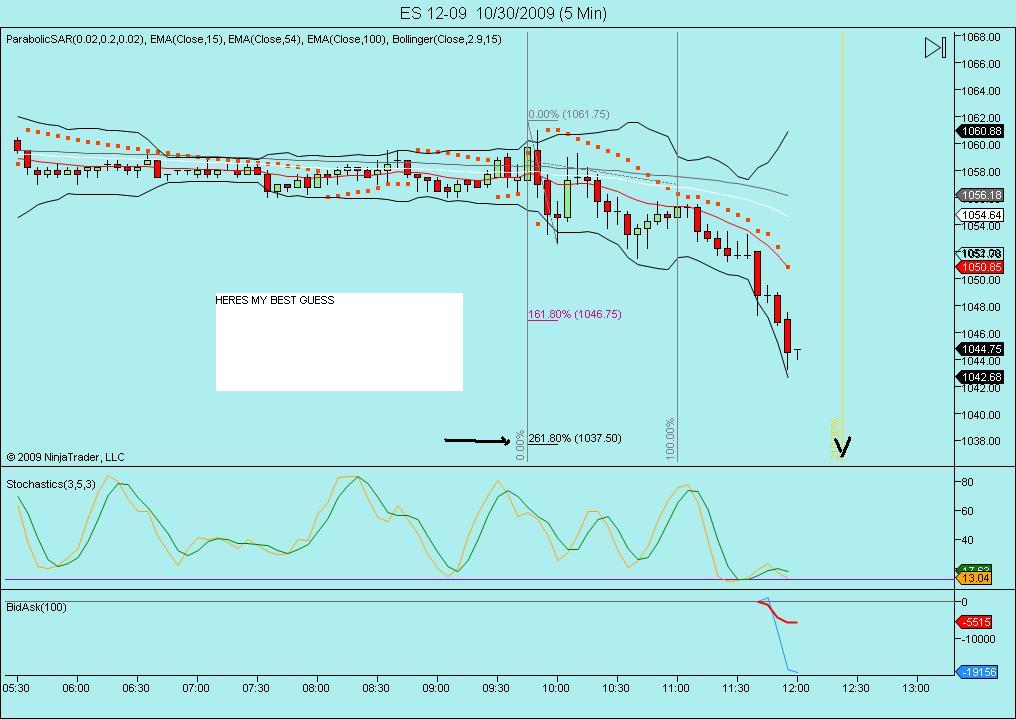
Mixed bag here for me ... if 82 area doesn't hold, then there's room to run to the downside at least to the 78-77 area near the session open/low potentially.
agree MM...if it wasn't for runners I would have been standing aside which doesn't actually make sense...in theory I should have exited the runners for the same reasons that I would have been standing aside...sometimes we just get lucky I guess
Click image for original size
Thanks Kool
Well, drilling down to the 1min chart, price couldn't even muster a bounce for about 13 minutes as it sat there on 82 so I got a small short on ... when it broke, some decent selling volume hit and a bigger velocity move ensued to the downside (more than I expected but got a few points out of it).
Another thing I noticed on the daily chart, especially if you scrunch the bars together tightly ... it seems that just about every multi-day bull run that pauses and has tight, narrow sideways consolidation resolves itself with a break DOWN below the lower end of the range and a multi-day pullback unfolds before resuming the uptrend to new highs ... referring to the the whole bull run so far this year. Just something to keep an eye on since we're now in one of those consolidation areas.
Man oh man, I hope you've still got some of those runners on Bruce!
quote:..ONCE AGAIN , EXACTLY THE WAY I SEE IT! There is a chance tho, with all the severe divergencies on the daily charts and even creeping into the weeklies that this correction could be more severe and last 2 weeks! Watching closely!
Originally posted by MonkeyMeat
Thanks Kool
Well, drilling down to the 1min chart, price couldn't even muster a bounce for about 13 minutes as it sat there on 82 so I got a small short on ... when it broke, some decent selling volume hit and a bigger velocity move ensued to the downside (more than I expected but got a few points out of it).
Another thing I noticed on the daily chart, especially if you scrunch the bars together tightly ... it seems that just about every multi-day bull run that pauses and has tight, narrow sideways consolidation resolves itself with a break DOWN below the lower end of the range and a multi-day pullback unfolds before resuming the uptrend to new highs ... referring to the the whole bull run so far this year. Just something to keep an eye on since we're now in one of those consolidation areas.
65.25 is my final...that's nothing but luck IMHO!!
I SAID A DAY GO IF 1033 DOESNT HOLD WE'LL LIKELY GET A TEST OF 1018-19.50.. STILL FEEL THAT WAY
Emini Day Trading /
Daily Notes /
Forecast /
Economic Events /
Search /
Terms and Conditions /
Disclaimer /
Books /
Online Books /
Site Map /
Contact /
Privacy Policy /
Links /
About /
Day Trading Forum /
Investment Calculators /
Pivot Point Calculator /
Market Profile Generator /
Fibonacci Calculator /
Mailing List /
Advertise Here /
Articles /
Financial Terms /
Brokers /
Software /
Holidays /
Stock Split Calendar /
Mortgage Calculator /
Donate
Copyright © 2004-2023, MyPivots. All rights reserved.
Copyright © 2004-2023, MyPivots. All rights reserved.