Looking to sell ?
This 1047 - 1050 area..lots of volume firing off up here....good day for a gap fill...
been away from the desk ... it never got back above 1093 on that bounce and took out the overnight lows shortly thereafter. The way it broke and the weakness felt like it might've been a quick trip down to that 1076-77 signif support I was watching and the 77.50 that you had Bruce. To me it would need to get above 88 (the 87.50 you mentioned) ... otherwise short seemed to be the way to go ... and would seem to me to be weak if today closes somewhat below that 88 area. I'm on sidelines for rest of session.
Thanks guys.
Today was a sleep in for me. The market is almost closed.
Looking at the trading, H 1099 at 6:32 and low 1082 at 11:39,
the way I see it is that they didn't take out the short stops above 1096.75 of 19 Oct at 12:37, 2.25 points isn't enough, so they won't leave those. MM pointed out the 1102.50 gap to fill and with lots of people seeing it they might have to run it above that by 4.50+ so 1107+. {My point and figure has a count to 1100 on 10 pt box so (1100-1109.75)}
At the lower end 1082 doesn't run out the stops below 1082.75 (19 Oct at 8:28),only -0.75, so I think they are loading up the boat on both sides.
They may run it to 1107.50-1107.75. And then really let it fall. I'm thinking 1077.50-1076.25.
Using 1107.50 down to 1077.50 gives a nice day (30 pts)
{Note 1107.50= 150% of -63.75 fall from 1075.75 to 1012.}
Nice info and rationale blue. At girlfriends currently this eve where I cannot for the life of me get her computer to load up my trading/charting platforms. One thing that stands out to me is that on the daily chart we're inside of a range for the past 4 days now, with today closing near the open, but at least above that 1093. Still a doji type daily bar. After hours trading may offer some xtra insight coming into the morning's open tomorrow (I'm quoteless and blind currently).
I still have those same significant S/R levels on my radar ... 1099-1102.50 above and 1078 area below, with some minor price levels too. Will be taking into account your described price moves/levels.
Just that one long trade for me this morning for 7 ticks (lucky to get that much) ... had a doctors appt mid-day. He said I'll be okay if I stick with drinking microbrews vs. Pearl Light. Market was "making sense" to me today in its price movements ... would be nice to have more of those!
We'll see what we can do in the morning!
Got TradeStation running on my girlfriend's computer and simply drew in the price action S/R lines on a 5min chart. Couldn't import my regular layout, so it looks weird to me. But the price levels denoted by the horizontal lines will be what I'm looking at for potential support and/or resistance and how price is reacting around these levels.
I'll bet dollars to donuts that I drew in the lines within a tick of what I drew on my trading software back home before I rolled over here. Anyway, it's something to look at and consider.
Anyone, feel free to post charts with analysis and rationale for coming into Wednesday's trading. Btw, if the daily "floor" pivots coincide with a price action level, it enhances its importance/effectiveness typically (especially weekly pivots) ... and also if the High or Low of after-hours/overnight trading lines up with one of these price action levels ... tends to enhance it further as a significant "inflection price."
In the end, it comes down to reading the flow of price supply and demand around these areas to plan a trade, along with your own indicators and analysis, including $TICK etc. All comments are welcome!!!
Click image for original size

Hi MM & Bruce,
About a week ago I came to a realization that picking High and lows was costly because it locked in my thinking. For example, imagine I was up at 6:30 for the 1099 pre-high. Well that's close to my 1100 target I've had for 2 weeks or so. Would I have taken 1099. Sure in hindsight for 20 pts to the downside. But in reality, I'd probably think, oh sure I short and then you ramp it up to 1106 and take me out.
So I think the floors thieves understand us very well. They know where we draw S/R lines and where the PP and MP is and they go to forums like this to see what the sheep are thinking and adjust their plans for tomorrows shearing.
All that aside, I do make estimates for the next day and I adjust those at open.
So I'll stay with my 1107.50 top area. +- 2 pts.
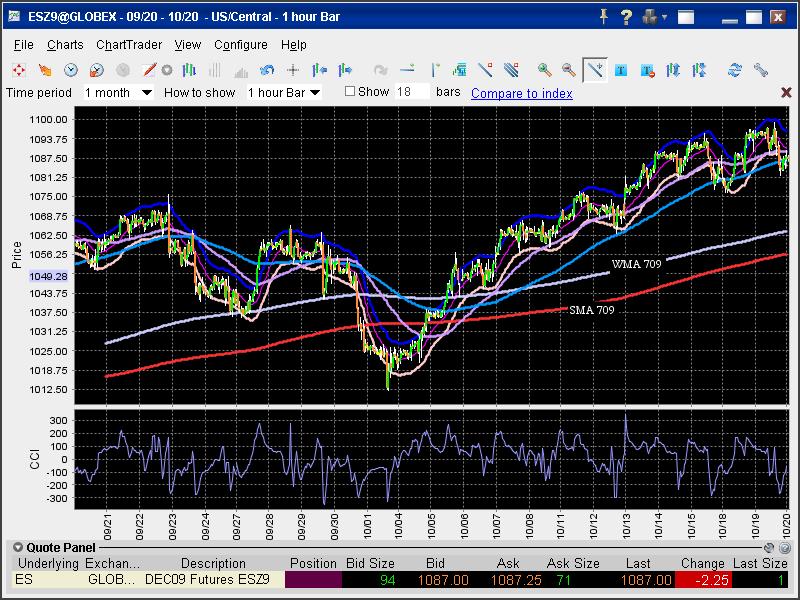
I've attached a chart as you requested MM
The way I read it:
There is no way to see the trend but up.
It has been flattening out over the last two days as they load the boat above 1099 and below 1082.
If we open around 1089.75:
Wendesday being Mercury is likely to be mercurial - rapid rises up and down "search and destroy pattern" as they ping it off upper and lower S/R as they gradually widen the band over the day.
Then they'll plow through one end or the other - and maybe both.
If I was smart I'd probably not trade tomorrow and avoid the bloodbath. But I'm not so if I trade it will be neutral bias and quick to exit if it starts to smell fishy.
About a week ago I came to a realization that picking High and lows was costly because it locked in my thinking. For example, imagine I was up at 6:30 for the 1099 pre-high. Well that's close to my 1100 target I've had for 2 weeks or so. Would I have taken 1099. Sure in hindsight for 20 pts to the downside. But in reality, I'd probably think, oh sure I short and then you ramp it up to 1106 and take me out.
So I think the floors thieves understand us very well. They know where we draw S/R lines and where the PP and MP is and they go to forums like this to see what the sheep are thinking and adjust their plans for tomorrows shearing.
All that aside, I do make estimates for the next day and I adjust those at open.
So I'll stay with my 1107.50 top area. +- 2 pts.
I've attached a chart as you requested MM
The way I read it:
There is no way to see the trend but up.
It has been flattening out over the last two days as they load the boat above 1099 and below 1082.
If we open around 1089.75:
Wendesday being Mercury is likely to be mercurial - rapid rises up and down "search and destroy pattern" as they ping it off upper and lower S/R as they gradually widen the band over the day.
Then they'll plow through one end or the other - and maybe both.
If I was smart I'd probably not trade tomorrow and avoid the bloodbath. But I'm not so if I trade it will be neutral bias and quick to exit if it starts to smell fishy.
Click image for original size
I agree, the trend is up (currently in consolidation near highs on daily). I've a different philosophy on the market players both big and small. The funds drive the SP with their variety of analysis in stocks ... which drives the index/futures. I sincerely believe there's a myth that there's a group of trading folks that are or can truly influence price with their focus being on savaging the small traders and the retail traders IMHO.
With everything computerized and arbitrage and quant/algorithm stuff coming from so many varied players ... it's still interesting to see how price continues to react around S/R price levels and even the floor pivots that have been around since before the Big Bang. Bruce's Market Profile understanding and read on the market is also pretty solidly outside of what the big guys are doing if manipulation and stop-runs are taken into account.
Not picking a bone with you at all. And it's not about necessarily picking highs or lows ... but rather those price levels being potential and likely important zones where there's something that can be felt/seen/uncovered in real time that offers either a trade whether long or short. And many times those levels reveal what the market is doing at the time but also it's tendency and propensity for what to expect in the near term.
Just my experience and input for what it's worth (or not).
If you would, Blue, fill me in on what indicators you're using from the above chart ... and how you use them.
Thanks ... good post.
MM
Don't mean to be going "off-thread" with these posts, but would be interested to hear Bruce and Jim weigh in on things from their perspective and trading. Perhaps we could begin a new thread on this and post the link here ... then keep this focused on analysis and trading. I don't want to be thread-jacking things.
we're in the "lounge" so please post anything that pops into your minds......for me I like to use the levels as ultimate targets but will always look to scale out at a plus or minus 4 number off the open print...especially if I have entered in the overnight........I'm also glad that the big traders know where the key stops are because we want to trade like them and the floor...so instead of waiting to eneter a short at a pivot number for example, we are the smart ones to be scalling out as we approach the key area and if we get lucky on runners then so be it......if it never gets to the key area then our runners get stopped out......
We are spending tons of time in the 84 - 85 number and lots of volume firing off there again in the overnight.......as usual we can use all the probabilities as we know they go for those a generic 80% of the time....I still think they want that 77.50 test and today is the day....I hope......good luck.
We are spending tons of time in the 84 - 85 number and lots of volume firing off there again in the overnight.......as usual we can use all the probabilities as we know they go for those a generic 80% of the time....I still think they want that 77.50 test and today is the day....I hope......good luck.
I agree with you guys that the trend is up...no question about it but sometimes we can see subtle signs that the trend may be trying to shift. For me I like to trade where it is not so obvious but trade placement is excellent when we are correct. When incorrect we can still take off some small pieces or take many small losses. I guess I just don't like it when things become too obvious. Folks become complacent and expect things to keep going...in this case up......it lulls us to sleep and then we miss those huge flush days to the downside...what I don't like about today is that there is all the volume in close proximity so it makes it harder to fiqure out the "best " numbers..
I've got key numbers running through 1083 - 1089 so unfortunately that is a bigger zone then I prefer of volume.....the good news is that we always have the overnight highs and lows, the rth highs and lows, the weekly pivotand the hour range. Also the plus and minus numbers ( these run at 100% probability)....in this volatility the plus and or minus 4 number ALWAYS hits so why not trade for it? Ok, enough babbling....we have enough reference points to day trade but I'd like to get a longer term hold going too sometimes....doesn't happen much for me...
I've got key numbers running through 1083 - 1089 so unfortunately that is a bigger zone then I prefer of volume.....the good news is that we always have the overnight highs and lows, the rth highs and lows, the weekly pivotand the hour range. Also the plus and minus numbers ( these run at 100% probability)....in this volatility the plus and or minus 4 number ALWAYS hits so why not trade for it? Ok, enough babbling....we have enough reference points to day trade but I'd like to get a longer term hold going too sometimes....doesn't happen much for me...
this may be a duplicate post concept ...we are opening in the center of the 1099 - 1077 range...so are we too expect the market to break one of the ranges and keep moving in that direction? It doesn't seem likely....seems like a fake out/ breakout is more likely....luckily we can monitor the volume and other markets for hints
I SAID A DAY GO IF 1033 DOESNT HOLD WE'LL LIKELY GET A TEST OF 1018-19.50.. STILL FEEL THAT WAY
Emini Day Trading /
Daily Notes /
Forecast /
Economic Events /
Search /
Terms and Conditions /
Disclaimer /
Books /
Online Books /
Site Map /
Contact /
Privacy Policy /
Links /
About /
Day Trading Forum /
Investment Calculators /
Pivot Point Calculator /
Market Profile Generator /
Fibonacci Calculator /
Mailing List /
Advertise Here /
Articles /
Financial Terms /
Brokers /
Software /
Holidays /
Stock Split Calendar /
Mortgage Calculator /
Donate
Copyright © 2004-2023, MyPivots. All rights reserved.
Copyright © 2004-2023, MyPivots. All rights reserved.