Chart of the day
Here is a gap and triples so up here at 1227 is my sell...look at the gap in between the white lines...just couldn't hold long with that looming
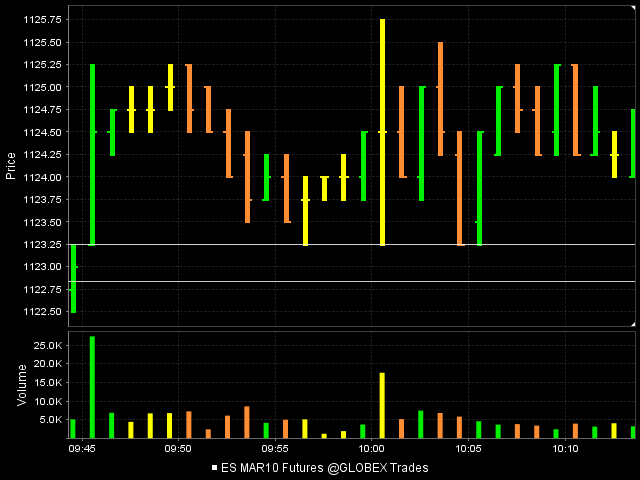
Click image for original size
note the overnight volume into the 1082.....these are the 10 point players . I'm trying to find buys into that today....82 - 83 should be key now.....
Originally posted by BruceM
made this flat on the way back up at 1090...we have the 10 point players...every 10 points off key volume new volume hits.....note the 92 and 1102 areas and volume...they'll keep trying to push it down by 10....
we have triples and volume spikes below this 1100 print...any takers??? we gotta watch if they push it up into the 1102- 1103 area too....conflicts mean less contracts
Stupid question Bruce..but by conflicts do you mean the volume above at 1102-03 and the triples below?
correct....and there are no stupid questions.....thinking is that we trade lighter if we are short off the 1100 print as they may still run it up BEFORE they go back down for the triples...then we could have added without as much stress up at the 1102 area...downside is that we don't have as much on when they went to test the first set of triples....a few seconds ago..
I think you understand the conflict with this trade..
I think you understand the conflict with this trade..
Originally posted by jyonkeeod
Stupid question Bruce..but by conflicts do you mean the volume above at 1102-03 and the triples below?
the additional conflict is that they just tested the HIGH of the highest one minute volume bar of the day...( at 97.25 high) ideally we'd like to get below that bar.....as you probably know with trends they will keep accepting the volume bar thrusts as the market moves higher in an uptrend....
gap still at 94...!!!
95 even is my final fill.. I don't want to wait around in case they want to TEASE us with that gap
Nice call Bruce...wish I was in their to capitalize, too many distractions at work for this newbie!!
Thanks for sharing
Thanks for sharing
i have a chart close of 1087 Red as per 4:15
I don't think the volume is an issue but it is just something I have observed. I personally would not look at 1 - 4 minute etc..you'd drive yourself crazy and find too many areas of consolidation. For me it's on the 5 minute or else I don't look for them.
Obviously they are not perfect and you can see 5 (5 minute bars) in a row down near the 988 area that have held.....those folks got rewarded but most times the triples give folks the false impression of being rewarded only to get run out later.
There are some who think that the floor or larger traders don't gun for stops.....while they may not gun for my SPECIFIC order I beleive they do know that folks are taught to keep stops just below or above swing points and consolidation areas, like the triples. This is why I am a fader and like things like previous highs and lows and volume areas. We just don't trend enough and spend a huge amount of time consolidating...
Bring up a 5 minute chart of the ES and see how often we get a trend away from a price without going back to fill in the breakout area later.....look for my thread called "Price bar overlap" soon. The RTH session begins for me at 9:30 e.s.t and ends at 4:15 . Everything outside of that time is considered the overnight session for me.
Originally posted by ak1
Thanks Bruce, if the triples are formed inside the days range on high volume will they be considered valid.Like the ones at 1006.5 on Friday. Also if we can't find triples in a 5 min. chart, is it OK to consider the 1 min chart then or do we go loking for them from 4min to 3min to 2min and then 1 min.i.e scale down.
Emini Day Trading /
Daily Notes /
Forecast /
Economic Events /
Search /
Terms and Conditions /
Disclaimer /
Books /
Online Books /
Site Map /
Contact /
Privacy Policy /
Links /
About /
Day Trading Forum /
Investment Calculators /
Pivot Point Calculator /
Market Profile Generator /
Fibonacci Calculator /
Mailing List /
Advertise Here /
Articles /
Financial Terms /
Brokers /
Software /
Holidays /
Stock Split Calendar /
Mortgage Calculator /
Donate
Copyright © 2004-2023, MyPivots. All rights reserved.
Copyright © 2004-2023, MyPivots. All rights reserved.