Chart of the day
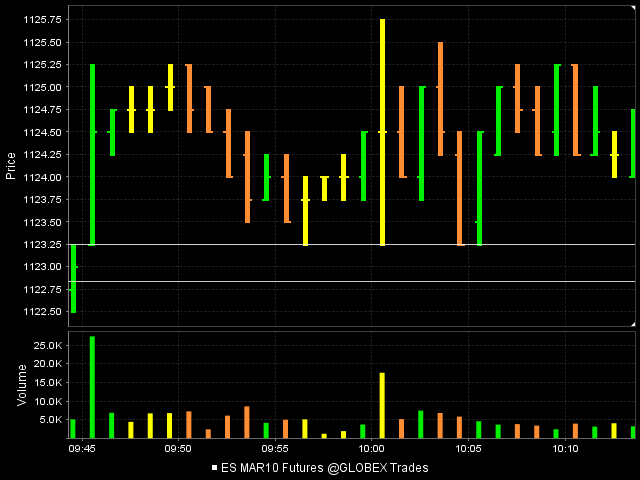
Here is a gap and triples so up here at 1227 is my sell...look at the gap in between the white lines...just couldn't hold long with that looming
Click image for original size
Originally posted by BruceM
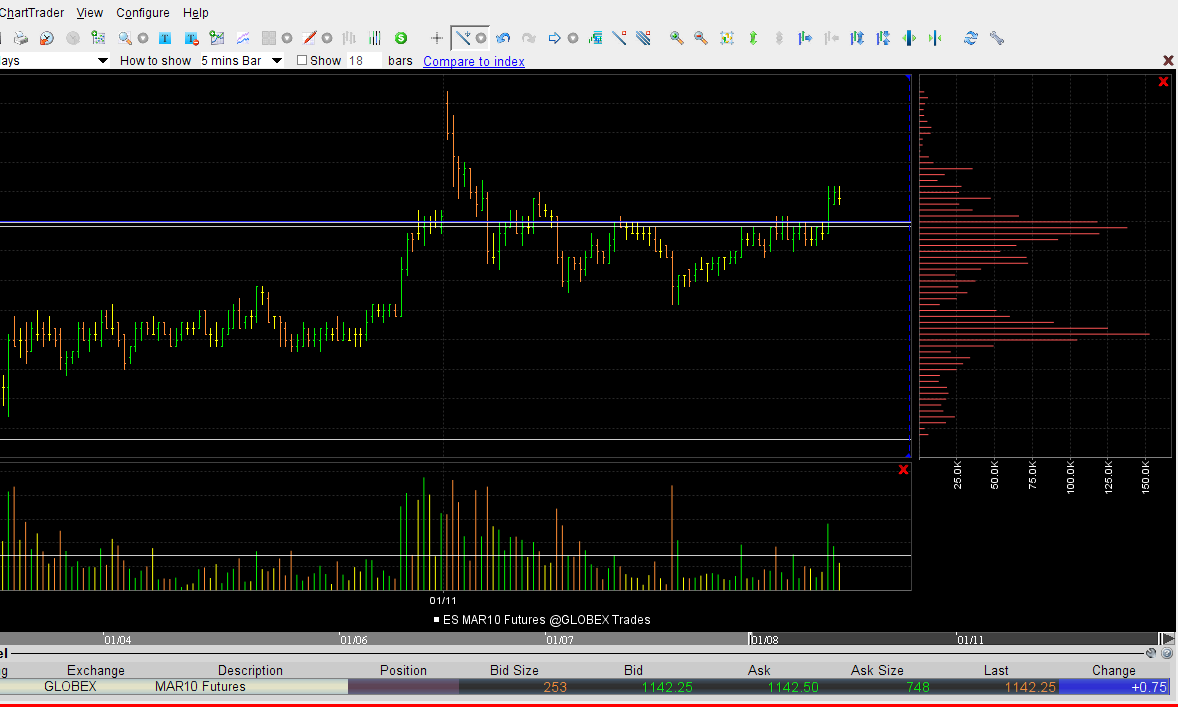
The volume profiles from today and friday are creating an interesting formation which still seems to be calling for a sell any rally mentality...
we basically have two high volume areas at 1136 and 1141....so there is lower volume in between those two points...I think if we can get sells at or above 41 we'd be doing fairly well as they will go to fill in the low volume
Seperating out the days we have a "P" profile on friday and a "b" profile today.....so you put them together and we get a buldge in the middle.....but it still needs to complete
Unfortunately my freakin charts aren't copying the volume profile portion of my charts...I'm not in favor of them trying to rally it after the bonds close like friday.....so still on the sell side..hope that actually makes sense and $$$$$ .
Here is a chart which shows just what the heck I was trying to convey. Hopefully someone will get something out of it. I actually had to fire up another computer while in this trade to take this shot from my IRA account chart...LOOK at the two volume spikes on the RIGHT side of the screen seperated by the low volume in the middle...that was critical for me to see so I knew to fade that pop up that ran out those triples....Luckily it worked..!! Sorry but this chart is even worse then my normal charts but the concept is what is important
Click image for original size
I'm long in O/N at the 35 level...volume is here and hoping day session will want to fill in the bell curve on the upside.....leftover triples in the 43 area....on the downside we have that 27.50 and of course the 23 number....we need to be careful inside the 36 - 41 area in general as we may need to back and fill a bit
Key point: I'm always more cautious on fading the plus and minus numbers when we open out of value....I was asked why I didn't try buying the minus 4 yeaterday......short answer is that we opened outside of value , didn't chop around and I had a bearish bias.
Key point: I'm always more cautious on fading the plus and minus numbers when we open out of value....I was asked why I didn't try buying the minus 4 yeaterday......short answer is that we opened outside of value , didn't chop around and I had a bearish bias.
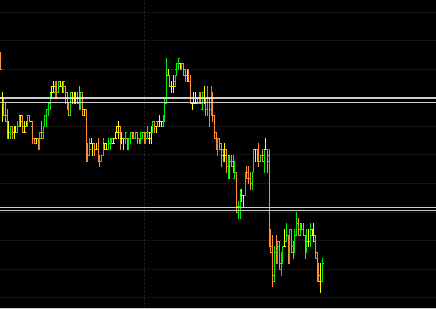
here is a chart of the overnight with lines snapped at the 36 and 41 levels....you can see how sellers are stepping up when we are above the upper horizontal line and buyers are trying to step up when we get below the lower lines........In theory we should see trade go back to at least the 1138.50 area in the RTH session as that is the midpoint between the 36 and 41 area....the 36 and 41 are the points with the most volume on a Horizontal basis...so time has been spent at those numbers
Us buyers are having a harder time below so that needs to provide us some feedback and caution
Us buyers are having a harder time below so that needs to provide us some feedback and caution
Click image for original size
mean reversion trading still in effect as long as we can hold the overnight low......with any real luck we'll get the gap fill and the 43 area......new lows with volume should try for that 27 number....but still long bias for me
geat call, friend on that 1127 test!
thanks for the good words Kool....yesterday became a game to me of trying to catch the plus or minus 4....I really thought it was going to be the plus 4 but when they created those triples just before noon below the open print then my bias changed.....sure seems they want higher trade and to go back up into the 41 - 43 area today...this would go well to fill in that volume area I thought they would fill in yesterday
And a nice long trade you had yesterday down in the 27 - 28 area....well done!!
And a nice long trade you had yesterday down in the 27 - 28 area....well done!!
1134 - 36 is the support zone to watch today.....good volume there and we have the close in there too.....
secondary support at 30 being tested...a failure here and they may be going for the 23 number
relatively speaking that breakout volume above 36 was HUGE!!! we need to be careful with any fades now.....pefect fill in of the 36 - 41 zone mentioned yesterday...that was a low volume area......A friend called me and told me he bought the hour break on the lows into the other key of 1130.....nice trade....for him!!
expecting a 41.75 retest from up in the 45 area.....triples just run from Mondays session above 43
I don't think the volume is an issue but it is just something I have observed. I personally would not look at 1 - 4 minute etc..you'd drive yourself crazy and find too many areas of consolidation. For me it's on the 5 minute or else I don't look for them.
Obviously they are not perfect and you can see 5 (5 minute bars) in a row down near the 988 area that have held.....those folks got rewarded but most times the triples give folks the false impression of being rewarded only to get run out later.
There are some who think that the floor or larger traders don't gun for stops.....while they may not gun for my SPECIFIC order I beleive they do know that folks are taught to keep stops just below or above swing points and consolidation areas, like the triples. This is why I am a fader and like things like previous highs and lows and volume areas. We just don't trend enough and spend a huge amount of time consolidating...
Bring up a 5 minute chart of the ES and see how often we get a trend away from a price without going back to fill in the breakout area later.....look for my thread called "Price bar overlap" soon. The RTH session begins for me at 9:30 e.s.t and ends at 4:15 . Everything outside of that time is considered the overnight session for me.
Originally posted by ak1
Thanks Bruce, if the triples are formed inside the days range on high volume will they be considered valid.Like the ones at 1006.5 on Friday. Also if we can't find triples in a 5 min. chart, is it OK to consider the 1 min chart then or do we go loking for them from 4min to 3min to 2min and then 1 min.i.e scale down.
Emini Day Trading /
Daily Notes /
Forecast /
Economic Events /
Search /
Terms and Conditions /
Disclaimer /
Books /
Online Books /
Site Map /
Contact /
Privacy Policy /
Links /
About /
Day Trading Forum /
Investment Calculators /
Pivot Point Calculator /
Market Profile Generator /
Fibonacci Calculator /
Mailing List /
Advertise Here /
Articles /
Financial Terms /
Brokers /
Software /
Holidays /
Stock Split Calendar /
Mortgage Calculator /
Donate
Copyright © 2004-2023, MyPivots. All rights reserved.
Copyright © 2004-2023, MyPivots. All rights reserved.