Chart of the day
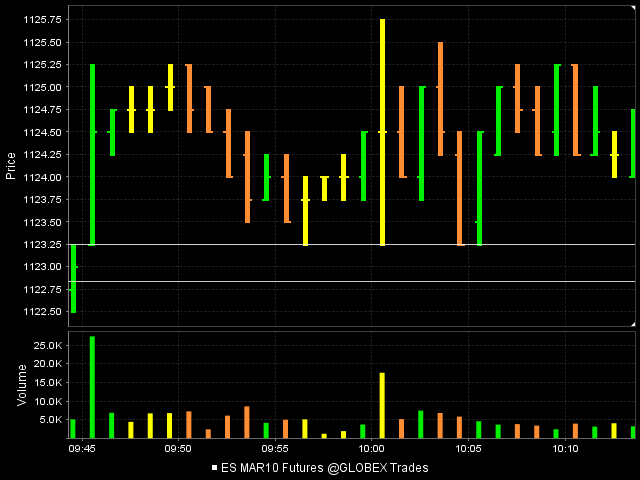
Here is a gap and triples so up here at 1227 is my sell...look at the gap in between the white lines...just couldn't hold long with that looming
Click image for original size
This was interesting from a conceptual standpoint....
The highest one minute volume came on the 10:08 est bar ( not shown on my chart) at a price of 1133- 1134.50 so we need to be snapping lines there...,
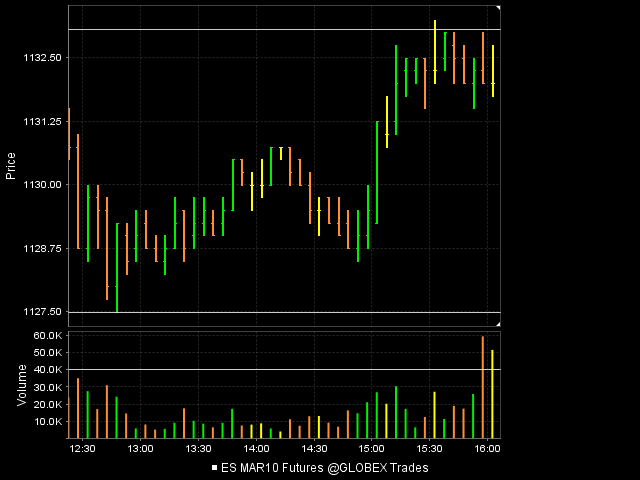
We had two sets of triples that where created after we tested a key number down in the 27 area...the triples formed at about 14:10 on my chart below and then another set at around 14:30
We then make a higher low and shoot back up to take out the triples and retest the highest volume bar of the day.....cool stuff
EDIT:I actually left out a key thing....there is a third set of triples that formed at the 1129 area ( look at those great matching lows)begining at about 13:35 on my chart...once they came back down to clean those up they then began the rally up...
The highest one minute volume came on the 10:08 est bar ( not shown on my chart) at a price of 1133- 1134.50 so we need to be snapping lines there...,
We had two sets of triples that where created after we tested a key number down in the 27 area...the triples formed at about 14:10 on my chart below and then another set at around 14:30
We then make a higher low and shoot back up to take out the triples and retest the highest volume bar of the day.....cool stuff
Click image for original size
EDIT:I actually left out a key thing....there is a third set of triples that formed at the 1129 area ( look at those great matching lows)begining at about 13:35 on my chart...once they came back down to clean those up they then began the rally up...
Very funny Red.....LOL....but isn't it true that the great thing about Volume is we don't really need to know "why" the spikes take place......There are so many different ways to trade these markets so why not let everyone else draw in all the lines and fibs etc and then we can wait until we see the volume to know somebody is responding at those prices.
This is not a slam on anyones methods here as I still draw lines too...just making a point. I respect you all and wouldn't dare belittle anyones ideas or methods.......unless your trying to sell me something...!!! Ha!
This is not a slam on anyones methods here as I still draw lines too...just making a point. I respect you all and wouldn't dare belittle anyones ideas or methods.......unless your trying to sell me something...!!! Ha!
Originally posted by redsixspeed
Bruce;
If you want to go down to hit your target, why did you buy
220k contracts yesterday
I'm not officially going on record as saying either red but they get taken out in the same day quite often...this makes sense as we have three mathcing highs or lows and folks know where people place their stops....The market also consolidates more than it trends so it is understandable that price can be "attracted" back to triples and frustrate all those who place stops there....I don't usually trade against them for long....especially on consolidation days........watch for them and you won't be disappointed over time.......these comments are meant for the RTH session only
Originally posted by redsixspeed
Bruce
Did you say the triples attract price?
Do they also act as an s/r area?
oh hell...I'll go on record...gheesh, been posting about them for over two years.....yeah they're attractors....not sure about S/R though
key areas/numbers where I'll be watching to see what happens with volume:
1136
1130
1127
1123:50
everything else is just noise.
Good luck today
1136
1130
1127
1123:50
everything else is just noise.
Good luck today
plan is to try and sell any rally if they don't test 27 area first....hopefully the sell will come above the 30 numnber too
trying from up at 33.75...hopefully not too early
filled at 34.25 and 37.75....you know you are in trouble when market orders on sells are getting filled at higher prices then you planned...2nd entry was the plus 5.5 after the 36 hit...sure looks like a trend....
final add is at 40.75...need back down at 37 area to make $$$...obviously not liking it....
I don't think the volume is an issue but it is just something I have observed. I personally would not look at 1 - 4 minute etc..you'd drive yourself crazy and find too many areas of consolidation. For me it's on the 5 minute or else I don't look for them.
Obviously they are not perfect and you can see 5 (5 minute bars) in a row down near the 988 area that have held.....those folks got rewarded but most times the triples give folks the false impression of being rewarded only to get run out later.
There are some who think that the floor or larger traders don't gun for stops.....while they may not gun for my SPECIFIC order I beleive they do know that folks are taught to keep stops just below or above swing points and consolidation areas, like the triples. This is why I am a fader and like things like previous highs and lows and volume areas. We just don't trend enough and spend a huge amount of time consolidating...
Bring up a 5 minute chart of the ES and see how often we get a trend away from a price without going back to fill in the breakout area later.....look for my thread called "Price bar overlap" soon. The RTH session begins for me at 9:30 e.s.t and ends at 4:15 . Everything outside of that time is considered the overnight session for me.
Originally posted by ak1
Thanks Bruce, if the triples are formed inside the days range on high volume will they be considered valid.Like the ones at 1006.5 on Friday. Also if we can't find triples in a 5 min. chart, is it OK to consider the 1 min chart then or do we go loking for them from 4min to 3min to 2min and then 1 min.i.e scale down.
Emini Day Trading /
Daily Notes /
Forecast /
Economic Events /
Search /
Terms and Conditions /
Disclaimer /
Books /
Online Books /
Site Map /
Contact /
Privacy Policy /
Links /
About /
Day Trading Forum /
Investment Calculators /
Pivot Point Calculator /
Market Profile Generator /
Fibonacci Calculator /
Mailing List /
Advertise Here /
Articles /
Financial Terms /
Brokers /
Software /
Holidays /
Stock Split Calendar /
Mortgage Calculator /
Donate
Copyright © 2004-2023, MyPivots. All rights reserved.
Copyright © 2004-2023, MyPivots. All rights reserved.