There's not much to add to Jim's yesterday post. I'll refrain from posting here long term setups which are not based on KT methodology.
PS. This might be a good contrarian indicator of a nearby turn :-) DJIA has just completed an ending diagonal almost to the day at 0.618 time retracement of Oct 2007 - Mar 2009 drop
RO
roofer
Rep: 3,689
Posts: 3,574
do not worry... i will continue to post trades based on my methodology....i invite traders to use the tools to reconstruct the blatant short in AAPL on friday morning.....
JI
jimkane
Rep: 3,058
Posts: 33,089
I think everyone is still missing my point... :-(
I mentioned that the ending diagonal, the new moon phase, the extreme low number of bears sentiment reading, and so on, are strong evidence that lean towards an intermediate top. The fact that although we are over the area of that huge monthly division line on the S&P detracts a little from the top theory, but it within a reasonable tolerance. Copper and crude 'breaking out', although, again, within a reasonable tolerance, are also detracting from the top theory, but it is still not too late for those to reverse. All these (and other things) are things I weigh when looking for areas to take a longer-term shot against a main trend.
Personally, for me, I don't see the odds favoring the smaller pattern against the bigger here. These tend to bounce up more before they fail. In other words, even if the long side is to fail, it usually respects the bigger pattern for a short while, then fails. Some crash right through, like when there is a big net player active, but odds-wise, that's the exception, not the usual. I play the odds.
As far as roofer, none of this applies to what he does at all. His style takes into account the overall trend exactly zero. He plays line to line, immediate support to resistance and resistance to support, with no consideration if that is or is not lined up with the trend. It is a highly successful method for him, and he appears to be among the most lighly skilled traders I have ever seen. That being said, there is a lot of overlap in techniques with my work, but the overall style is very different.
The main thing I am trying to get people to see between roofer's style and mine (as it is conceptually very important to understand as you try to form a plan that works for you and your personality), and apparently I'm just not getting across, is this. roofer plays line to line, with the trend and counter trend. When it hits the support or resistance area of the same degree based on his line work, he closes the trade out, and frequently goes to the other side if that target area is also good enough for a setup. There is no differentiation of whether the play is with trend or countertrend.
I do exactly the same plays many times. But, if it is with trend, I give a lot of leeway at the next area, giving it a lot of room to blow the area out, and to stay with the trend if it continues. By the time I see the area is going to turn it around, it's usually too late for me to get on the other side. Now, if I have some things coming in on that other side from a higher timeframe, then I may have my trailing stops tighter, and get out in time to get over to the other side. This gets into complex issues of timeframe that are far too much to discuss here, but is something I cover with students.
If the move is countertrend, i.e. I did get in on the other side as just discussed in the last paragraph, I have very tight stops as the next area is hit, so that I can get on the trend side for sure. I don't wait around much to see if the area will 'blow out', as I don't want to miss the trend side. In that way, other than roofer profit targets and I basically only scale out when it goes against me, what we do in this case, ultimately, is almost exactly the same. Line to line, and over to the other side if the trade setup is there. I just use trailing stops and not profit targets.
The key is the trend, and how my play changes when it is with trend, and when it is countertrend. This is important to understanding how I manage a play, how I choose a premise, and so on, and that's why I keep bringing it up. It's a key KT concept, and it is being missed, and the more I try to explain it, the more it seems to have the wrong effect on everyone...
I welcome posts of different styles in here, I just have to make sure those who come to the forum wanting to learn more about the KT methodology have clear notes from me as to exactly what my methodology is. Other Fib and line techniques are welcome here, but I will make clear what my work says, and why, as that is the main purpose of this forum.
I almost sent jarek an e-mail after that last post telling him not to do anything different because of that post, it wasn't directed at him. I find myself 'posting on eggshells' in that I am worried with every post that someone will take it the wrong way. Hence, I keep doing these longer and longer explanations, and they seem to just make it worse. There are very key KT philosophies being missed, and I'm trying to help people understand them, that's it. Post away, just understand and accept that I will try to make clear the KT methodology and its viewpoint in here.
Please, post the ending diagonal, I think everyone should see that. I posted one awhile back myself. Just understand, the last one failed miserably after pulling right back to support and then right back up, and I'll likely trade this one the same way, and I'll surely comment on the long setup if/when it forms. That makes for good give and take in here.
JA
jarek
Rep: 94
Posts: 3,474
Here is the potential ending diagonal on DJIA:
It has to drop straight to the red line in order to confirm this count. If it fails to do so it would mean that one more high is due in an ending diagonal that started at November low. In such case we would have to wait little longer for an initial drop but it would be much stronger and reach almost the bottom of the chart above.
Click image for original size
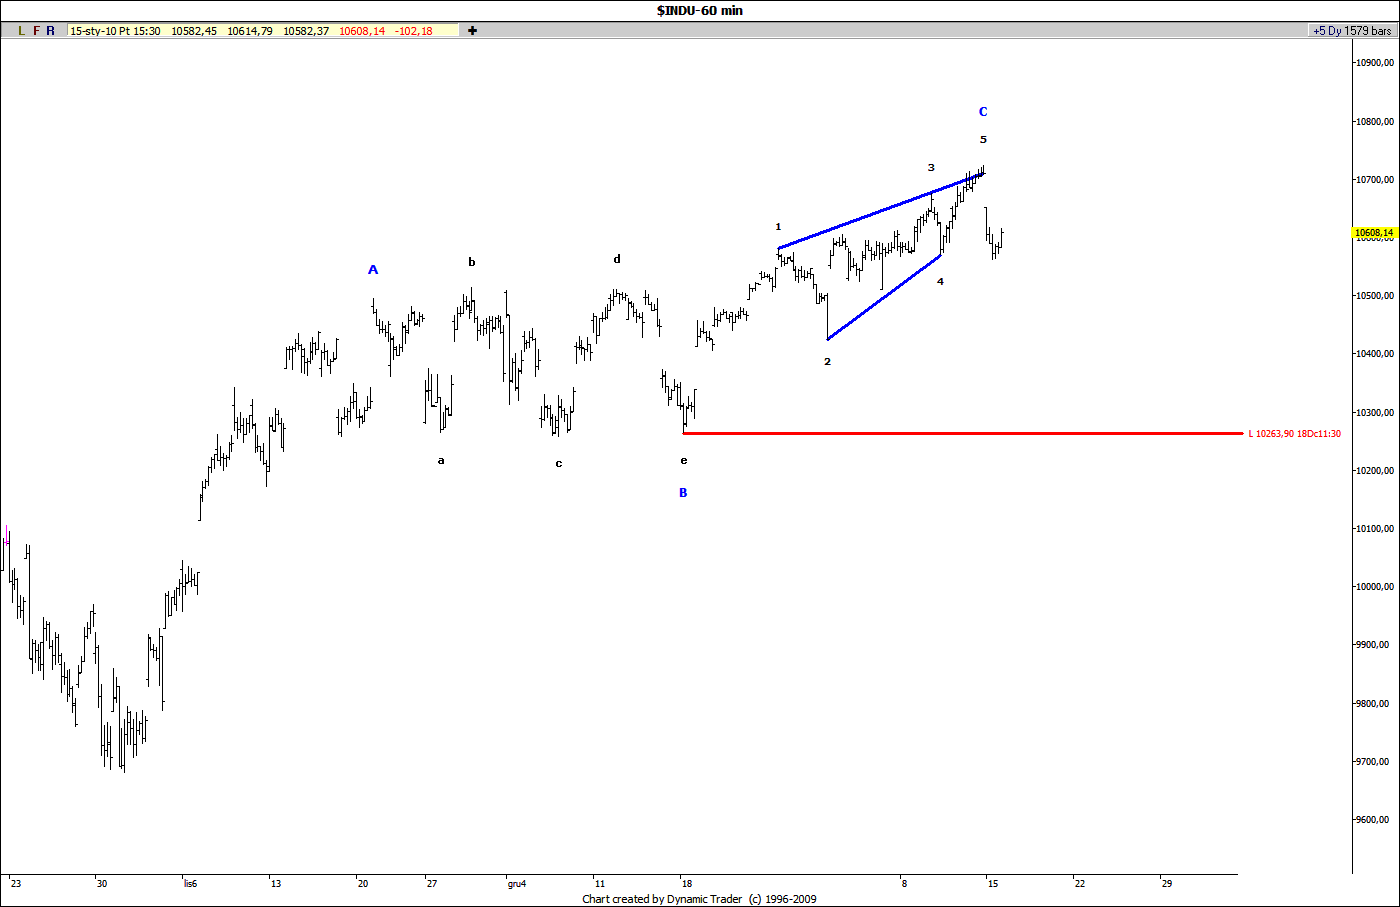
It has to drop straight to the red line in order to confirm this count. If it fails to do so it would mean that one more high is due in an ending diagonal that started at November low. In such case we would have to wait little longer for an initial drop but it would be much stronger and reach almost the bottom of the chart above.
JA
jarek
Rep: 94
Posts: 3,474
Originally posted by roofer
i invite traders to use the tools to reconstruct the blatant short in AAPL on friday morning.....
It had to be this one:
Click image for original size
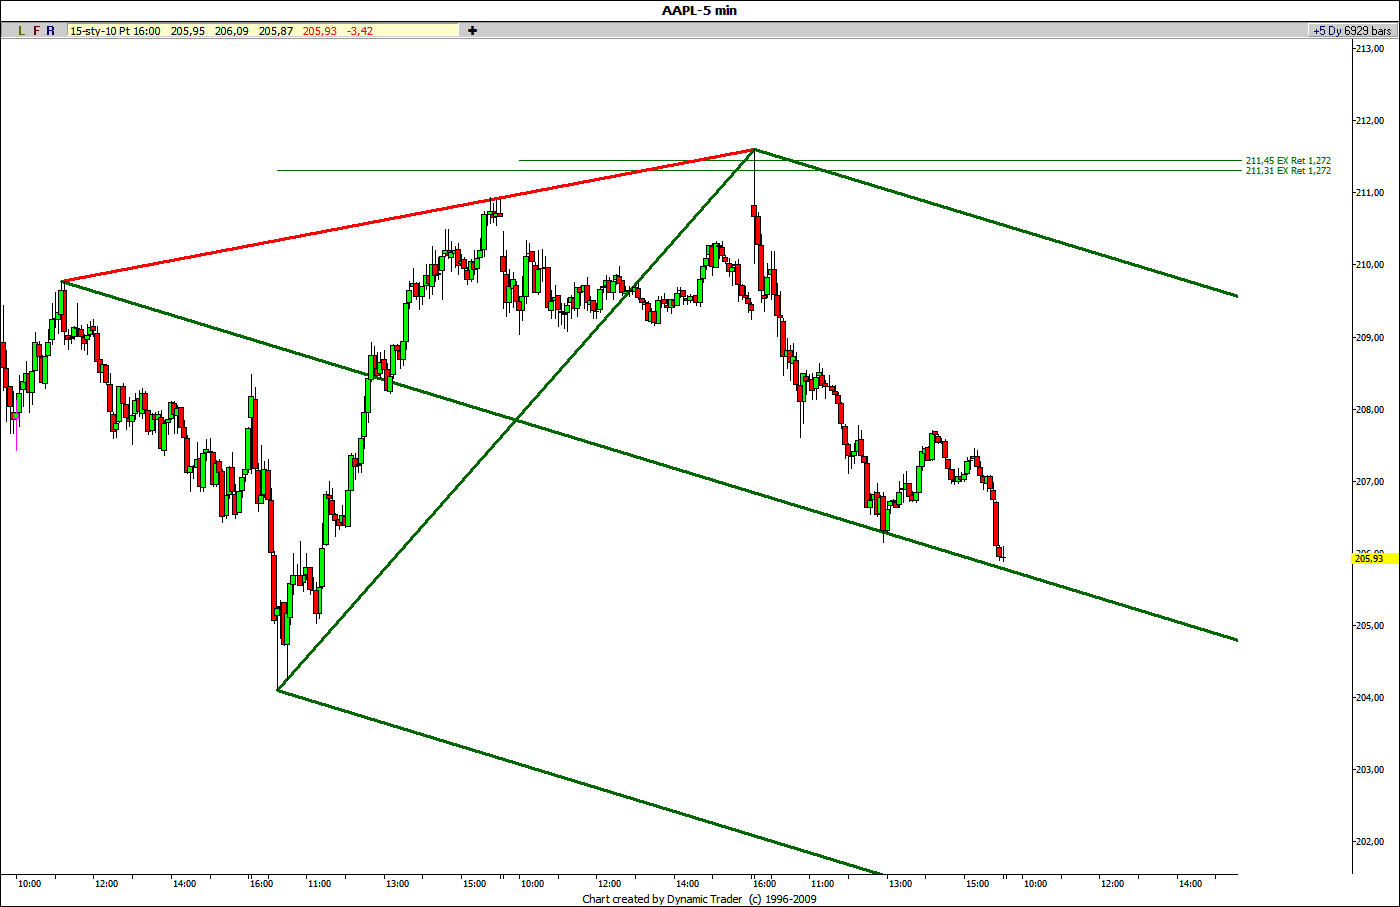
Like Jim said: 'line to line'
JI
jimkane
Rep: 3,058
Posts: 33,089
Nice charts, jarek.
Keep in mind, everyone, Monday is MLK day and the markets are closed.
Keep in mind, everyone, Monday is MLK day and the markets are closed.
JA
jarek
Rep: 94
Posts: 3,474
Originally posted by jimkane
Monday is MLK day and the markets are closed.
Maybe it's the only chance to beat that Sunday night - Monday pattern :-)
RO
roofer
Rep: 3,689
Posts: 3,574
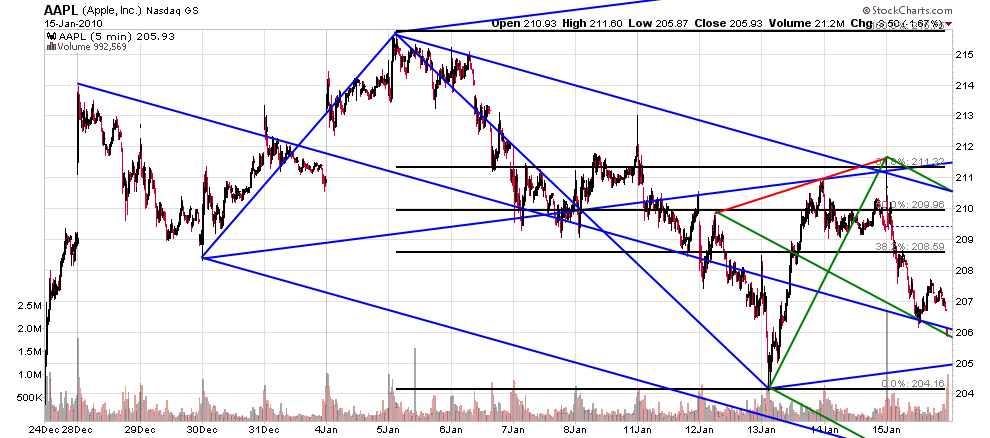
jarek that was a nice start!now , if you care to, go back futher and honor the whole mantra.... the line sorts the fib, the fib sorts the line, THEIR COMING TOGETHER SORTS THE IMPORTANCE OF PRICE AT LINES FROM EXISTING TRADITIONAL MEDIANLINE SETS and generates a non traditional ml set based on the frequency of the red line... you will find an X marks the spot based on upsloping and downsloping sets at.618 confluent with THE TRADE setting up.
SH
shmendel
Rep: 0
Posts: 33
Click image for original size
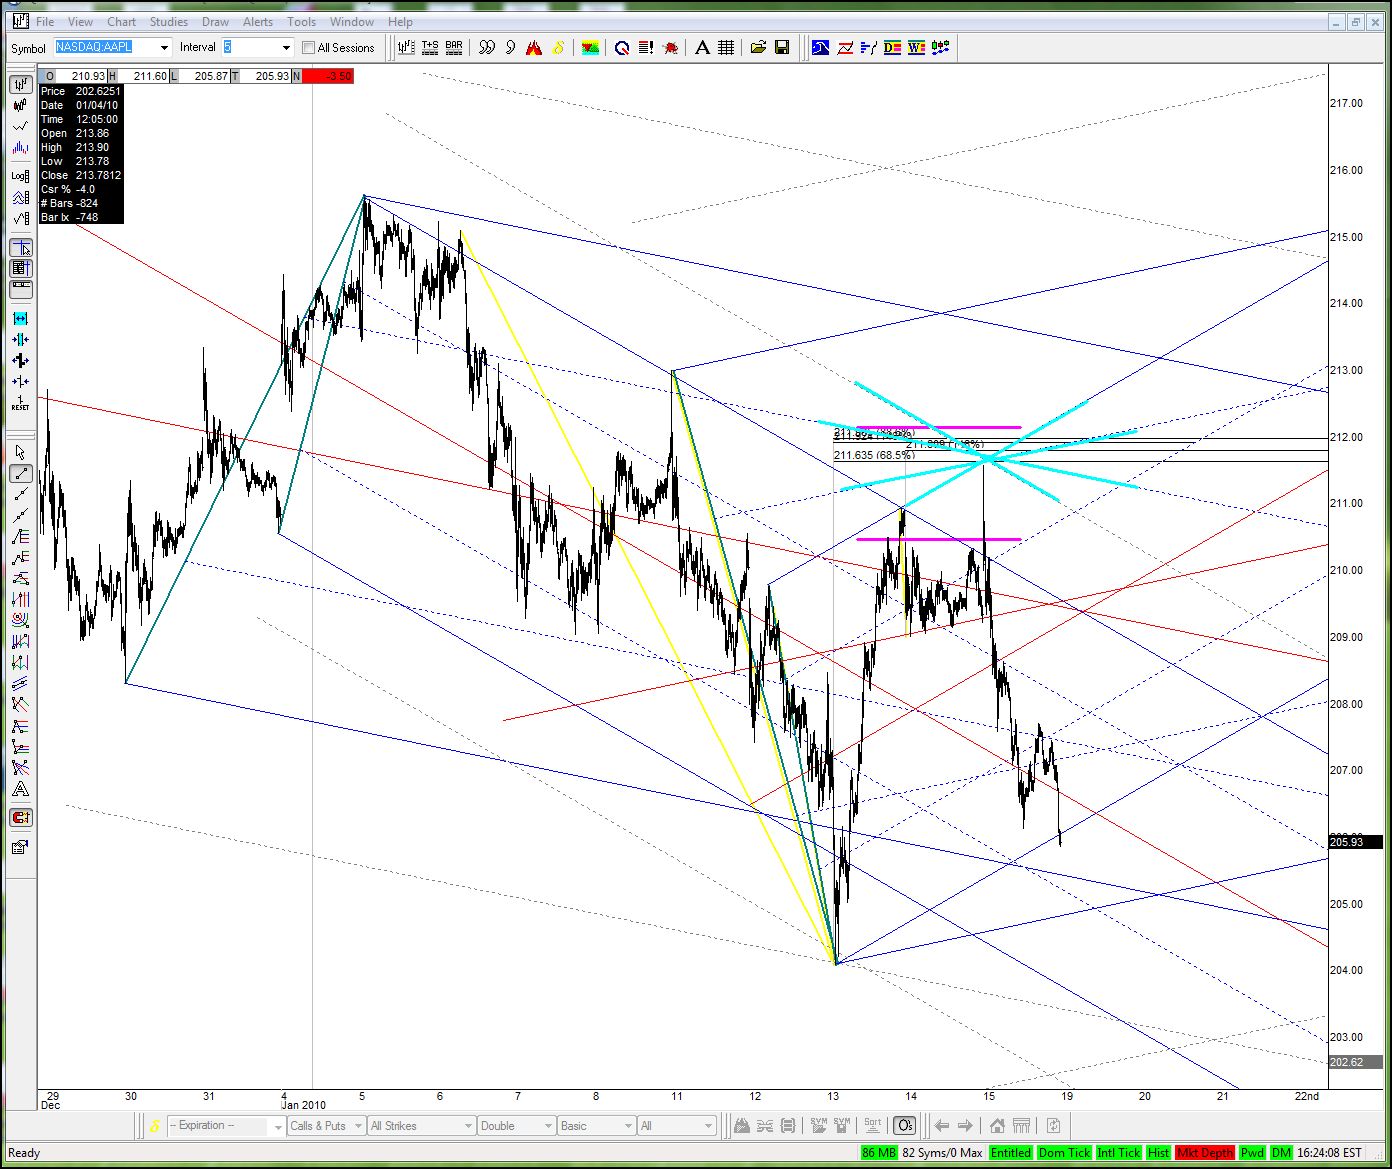
Lines from 4 adjusted sets but ? harmonicity at the peak (or not as tight as I'd like).
Roofer, is this a lightning trade?
RO
roofer
Rep: 3,689
Posts: 3,574
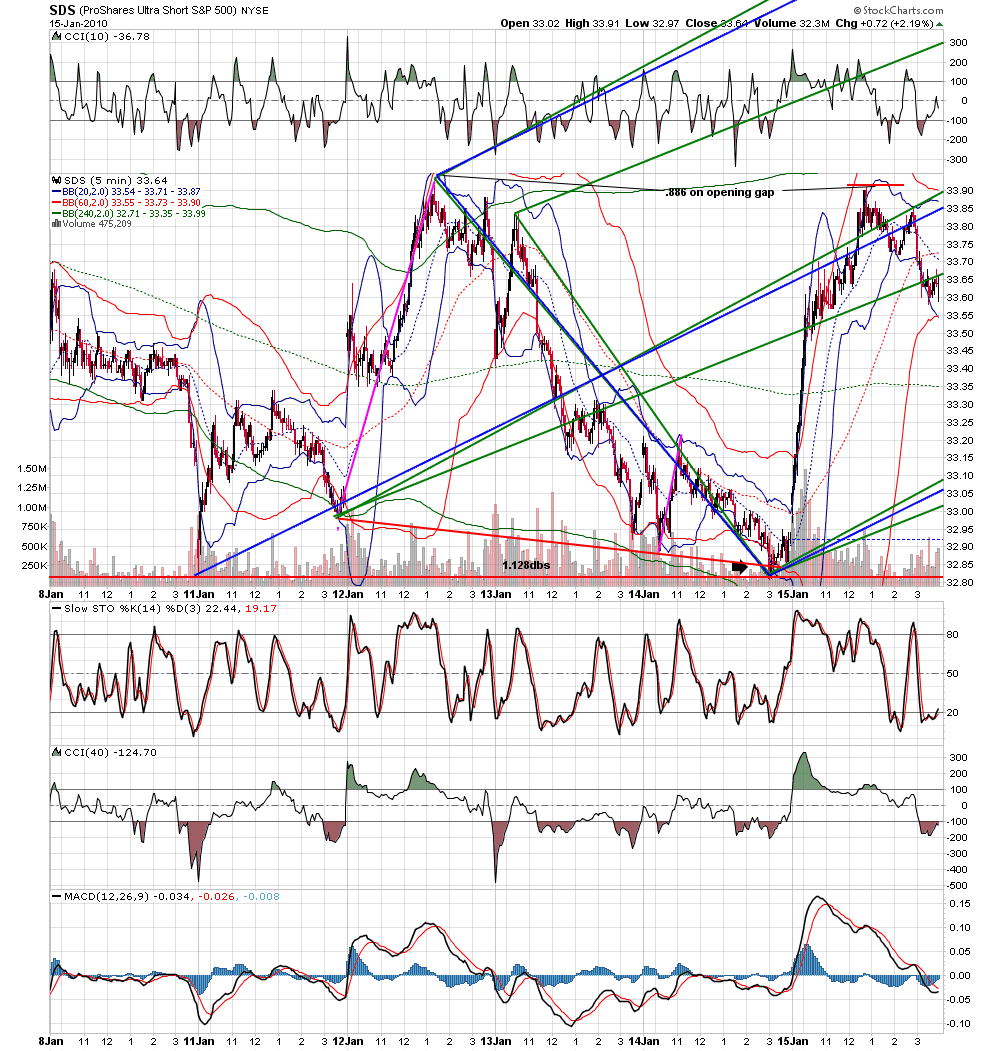
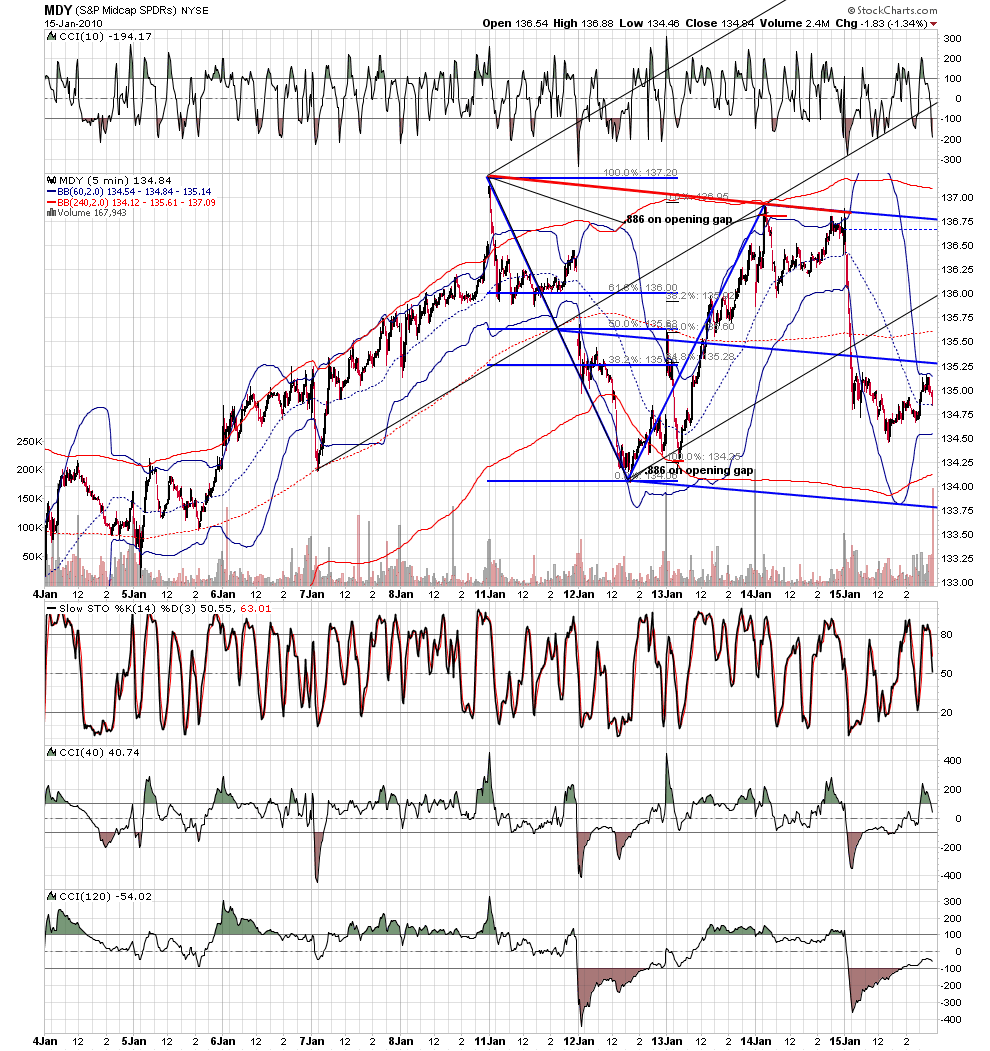
look how the different etf's telegraphed the markets intent
my thinking on my way of trading is this... the supercomputers we are trading with or against, that can do as many calculations in one second that the most powerful personal computer takes 2.6 WEEKS! to do,need price to move,BUT ONLY SO MUCH AND IN AN ORDERLY FASHION, TO GENERATE PROFITS..i believe that we can only see a tiny, tiny portion of their intent.... but as long as they do the same thing over and over and our tools catch it.... that is good enough...it is beyond remarkable to me that NO ONE has yet commercialized the .886 on opening gap...and yet it is SO FREAKIN CLEAR how the computers continue to focus on it.
Click image for original size
Click image for original size
Click image for original size
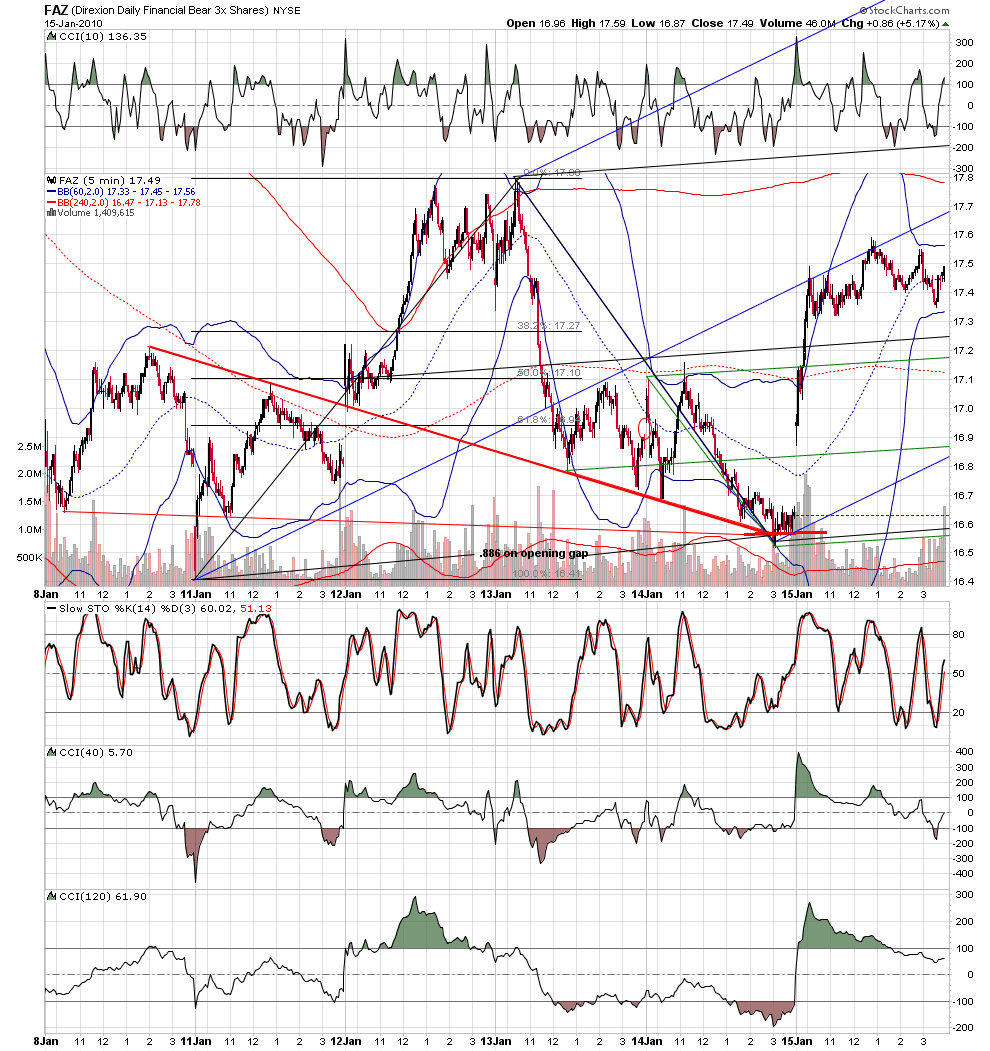
my thinking on my way of trading is this... the supercomputers we are trading with or against, that can do as many calculations in one second that the most powerful personal computer takes 2.6 WEEKS! to do,need price to move,BUT ONLY SO MUCH AND IN AN ORDERLY FASHION, TO GENERATE PROFITS..i believe that we can only see a tiny, tiny portion of their intent.... but as long as they do the same thing over and over and our tools catch it.... that is good enough...it is beyond remarkable to me that NO ONE has yet commercialized the .886 on opening gap...and yet it is SO FREAKIN CLEAR how the computers continue to focus on it.
RO
roofer
Rep: 3,689
Posts: 3,574
i hope all grasped what i did... i did not forcast.... i simply used the tools of this forum across all my traders until there was not a single buy signal left... that is when important reversals occur...AT THAT MOMENT IN TIME!!!!, THERE IS SIMPLY NO GEOMETRY LEFT TO SUPPORT THE MARKET....jim is perfectly correct to be looking for ABCD'S.... I AM TOO..but looking across hundreds of charts, i believe price was at or near this years high at the recent high...i have no big ideas of how important this high was based on theoretical constructs.... just trading the tools....as the machine that grinds.