There's not much to add to Jim's yesterday post. I'll refrain from posting here long term setups which are not based on KT methodology.
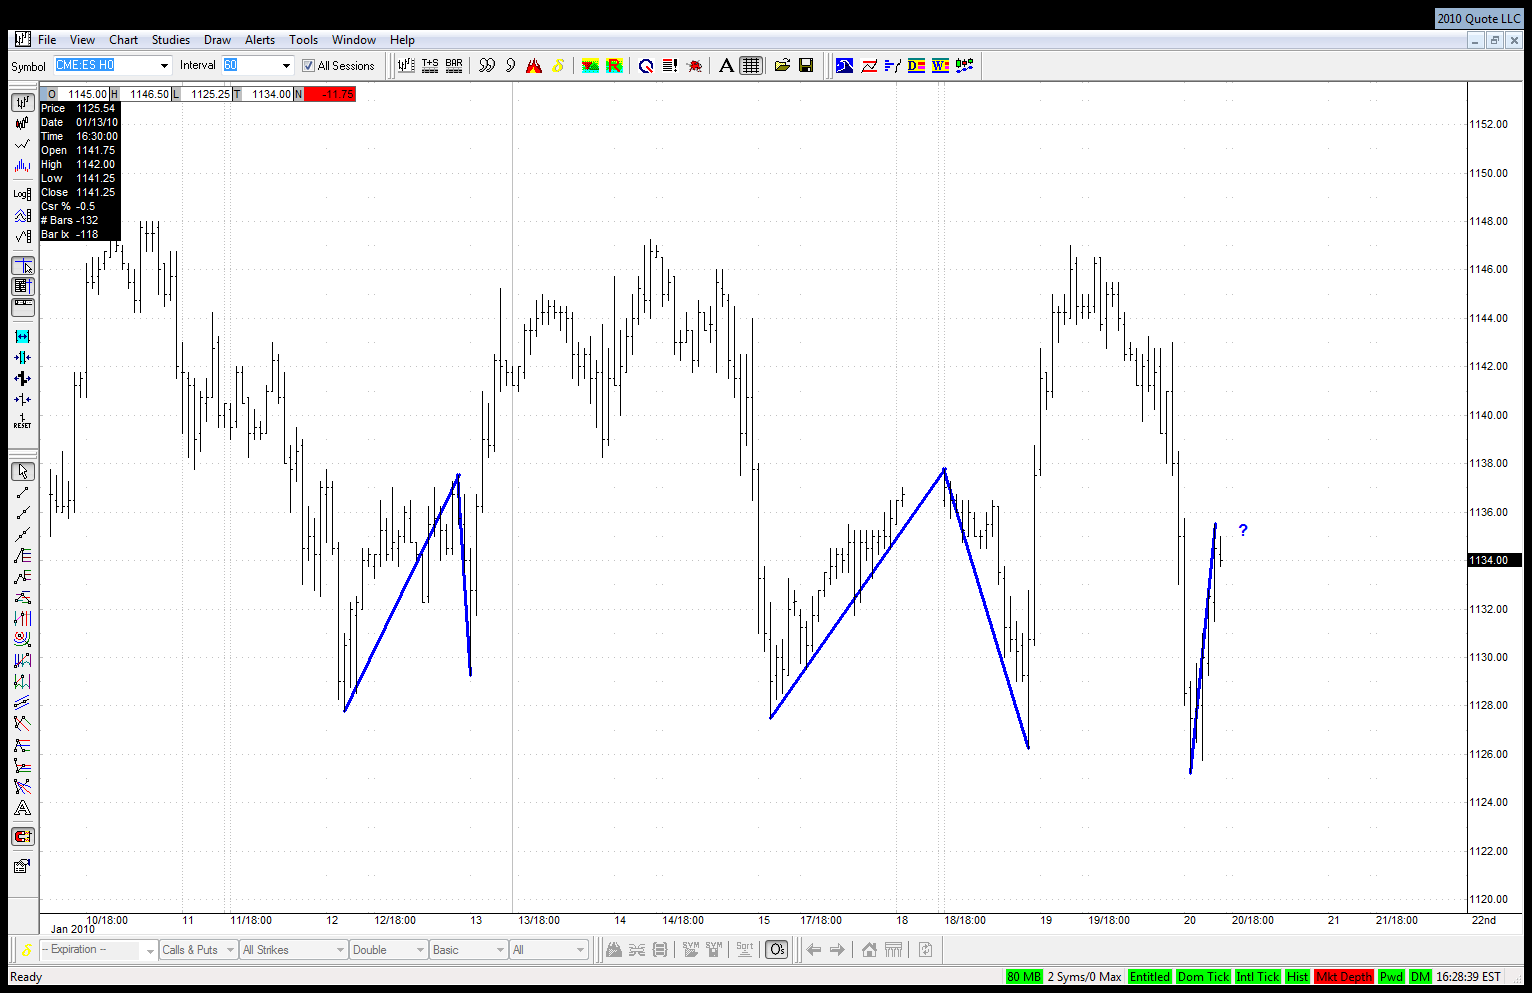
PS. This might be a good contrarian indicator of a nearby turn :-) DJIA has just completed an ending diagonal almost to the day at 0.618 time retracement of Oct 2007 - Mar 2009 drop
JI
jimkane
Rep: 3,058
Posts: 33,089
There's another new high for the move off support. Can't wait to see if they run this back up, or kill it in here.
JA
jarek
Rep: 94
Posts: 3,474
Originally posted by jimkane
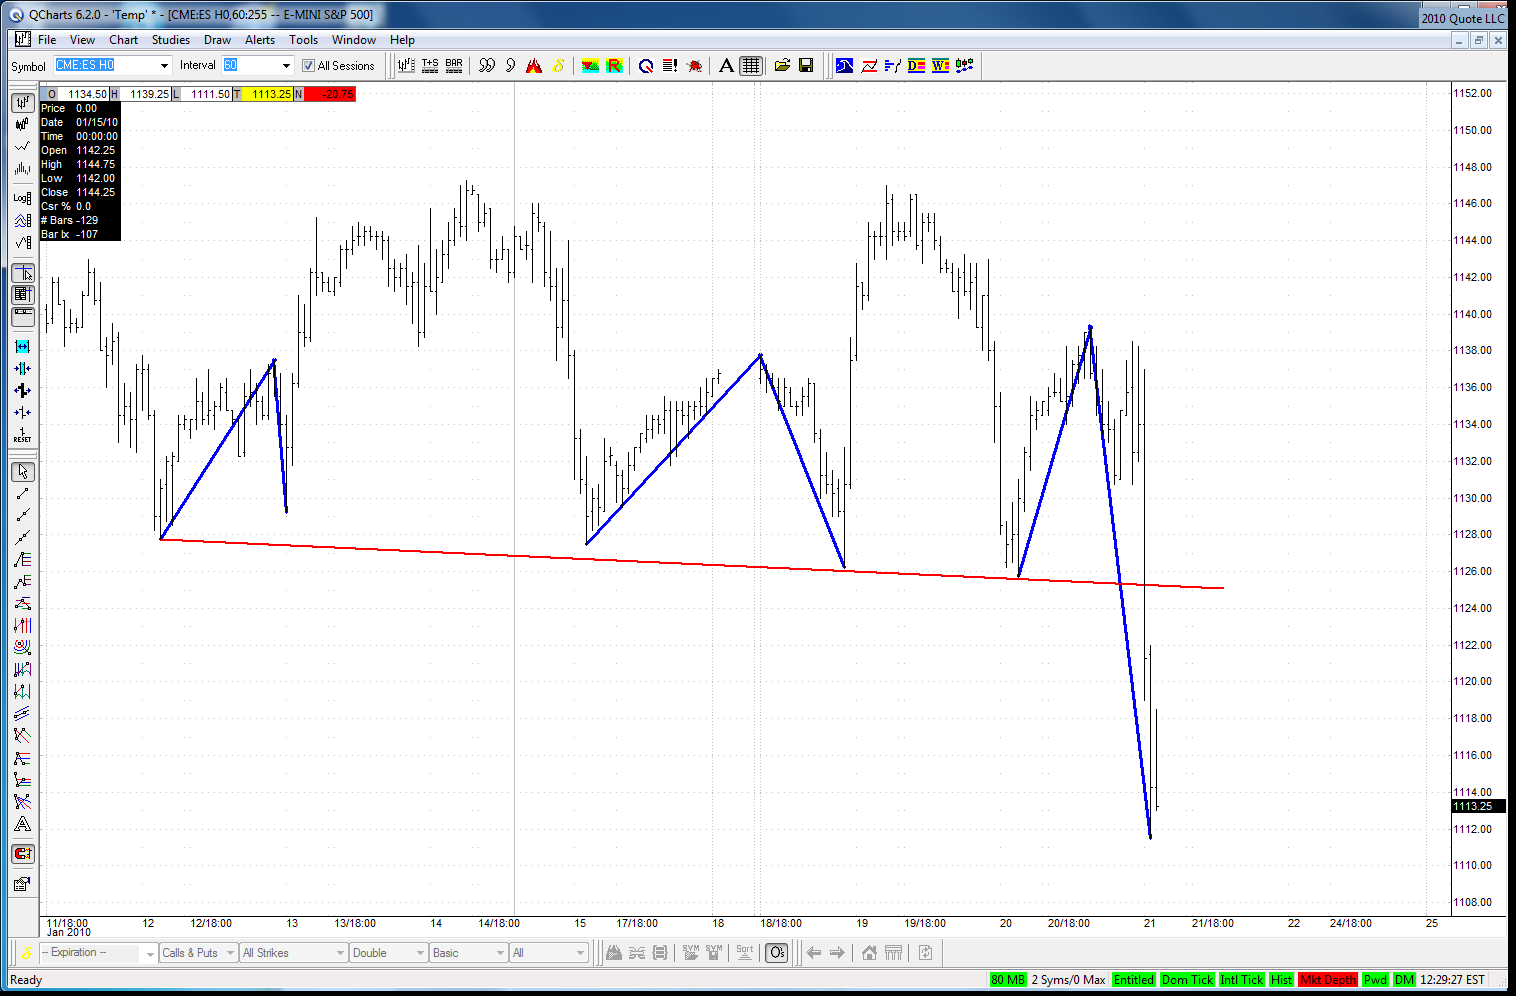
...This is three times now in a row it hit this level and bounced this much. Both other times it rolled back to the low, then went to the range top. The odds don't favor another repeat, as surely everyone sees this...
As expected the support area didn't hold this time:
Click image for original size
JA
jarek
Rep: 94
Posts: 3,474
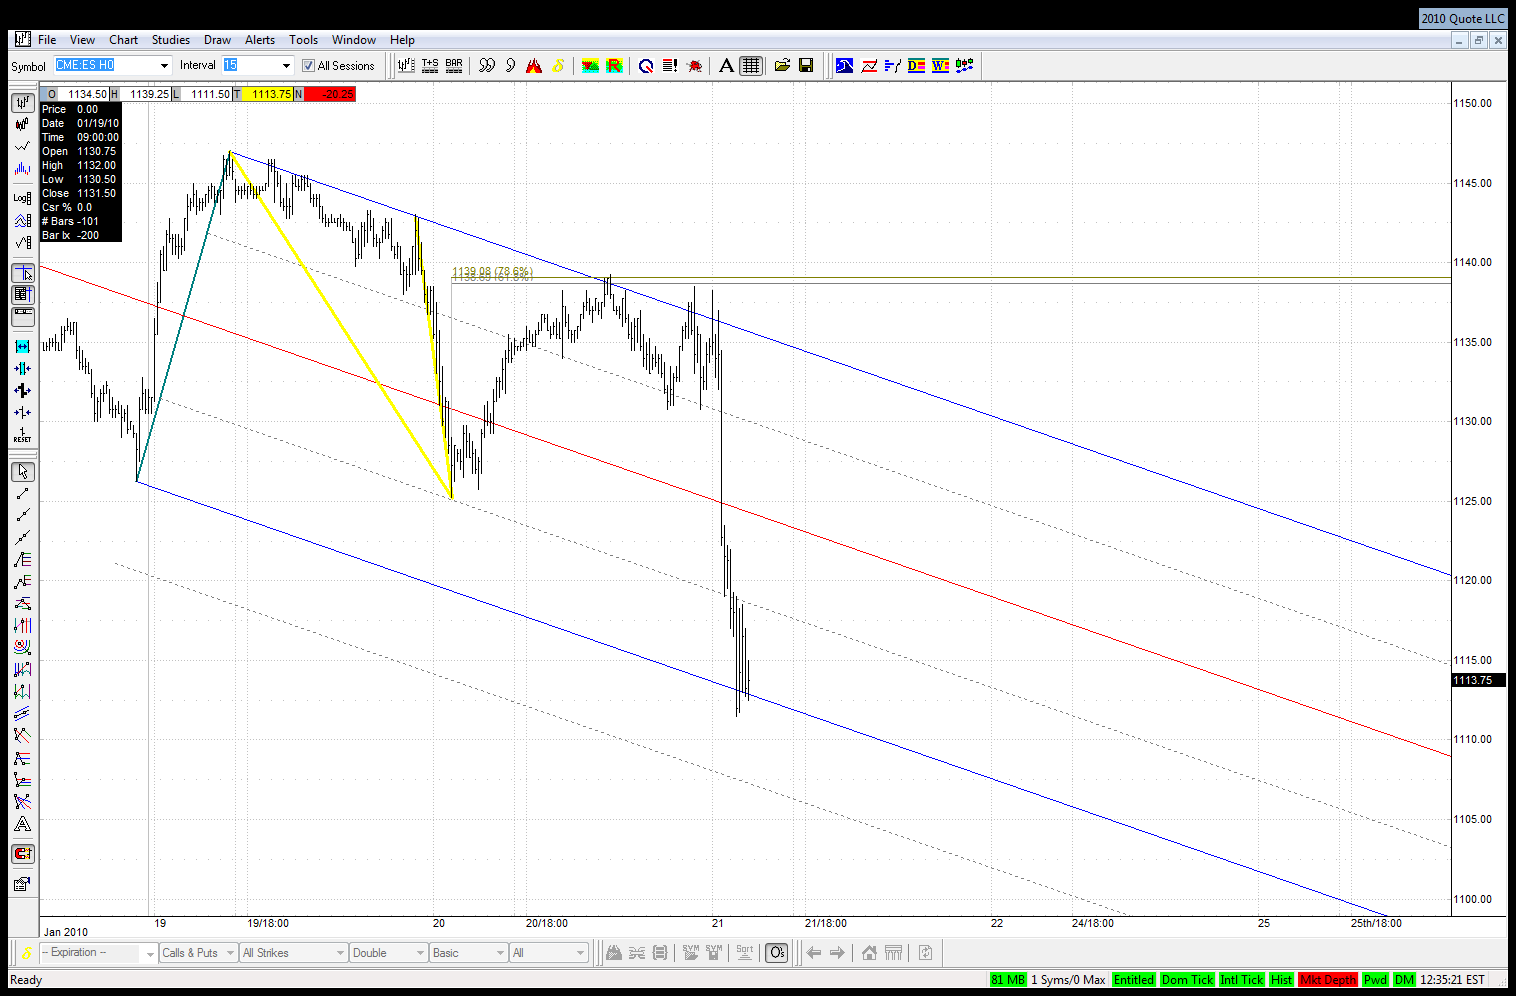
Our last set from yesterday was THE SET but the price needed deeper retracement and went to upper ML:
Click image for original size
JA
jarek
Rep: 94
Posts: 3,474
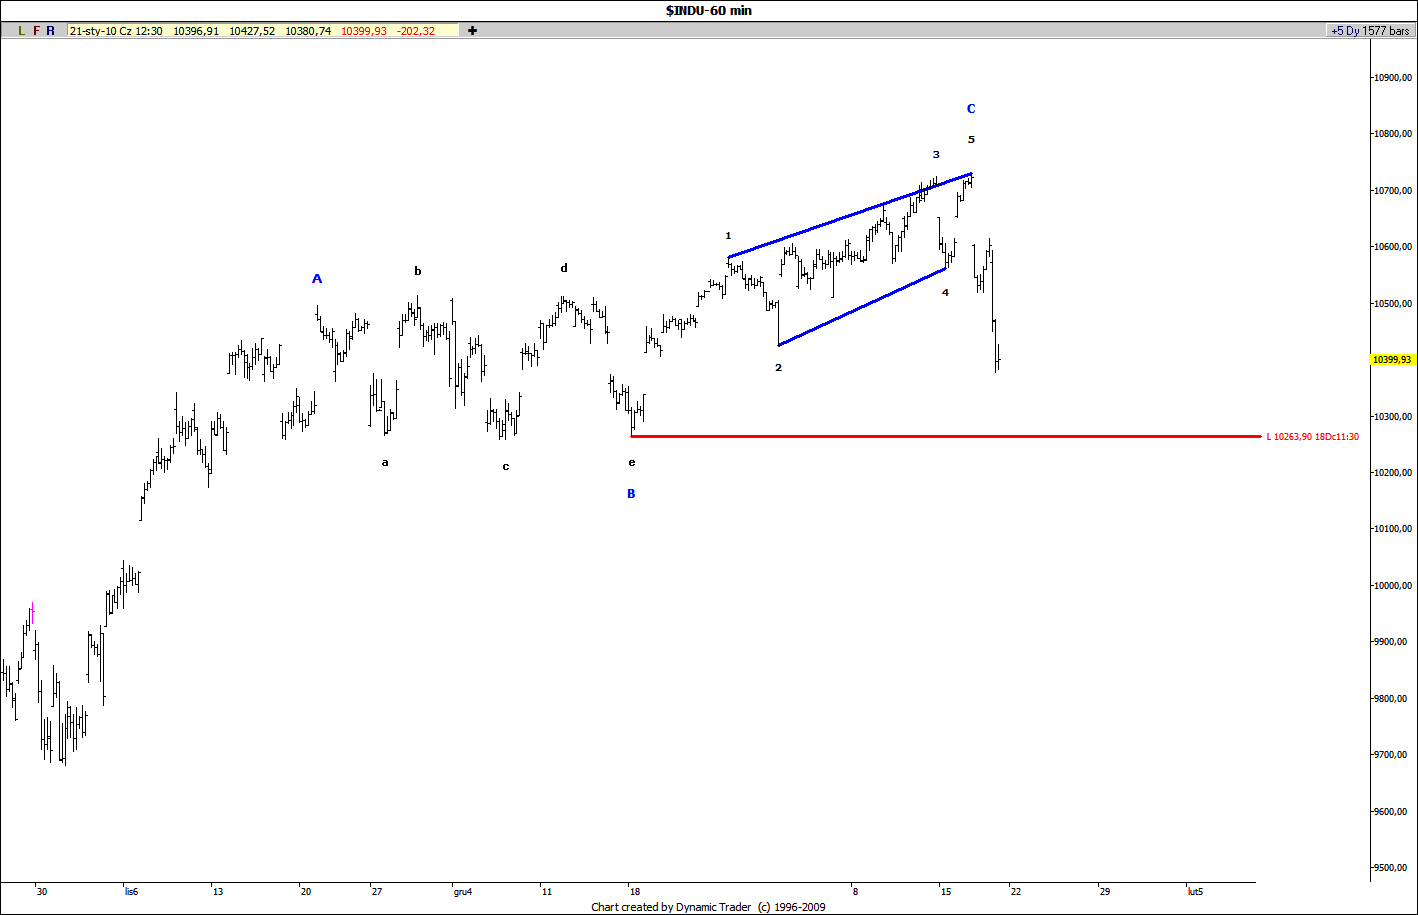
In fact my ending diagonal count might not have been that far off. From the recent price action this is what I would expect:
Click image for original size
JA
jarek
Rep: 94
Posts: 3,474
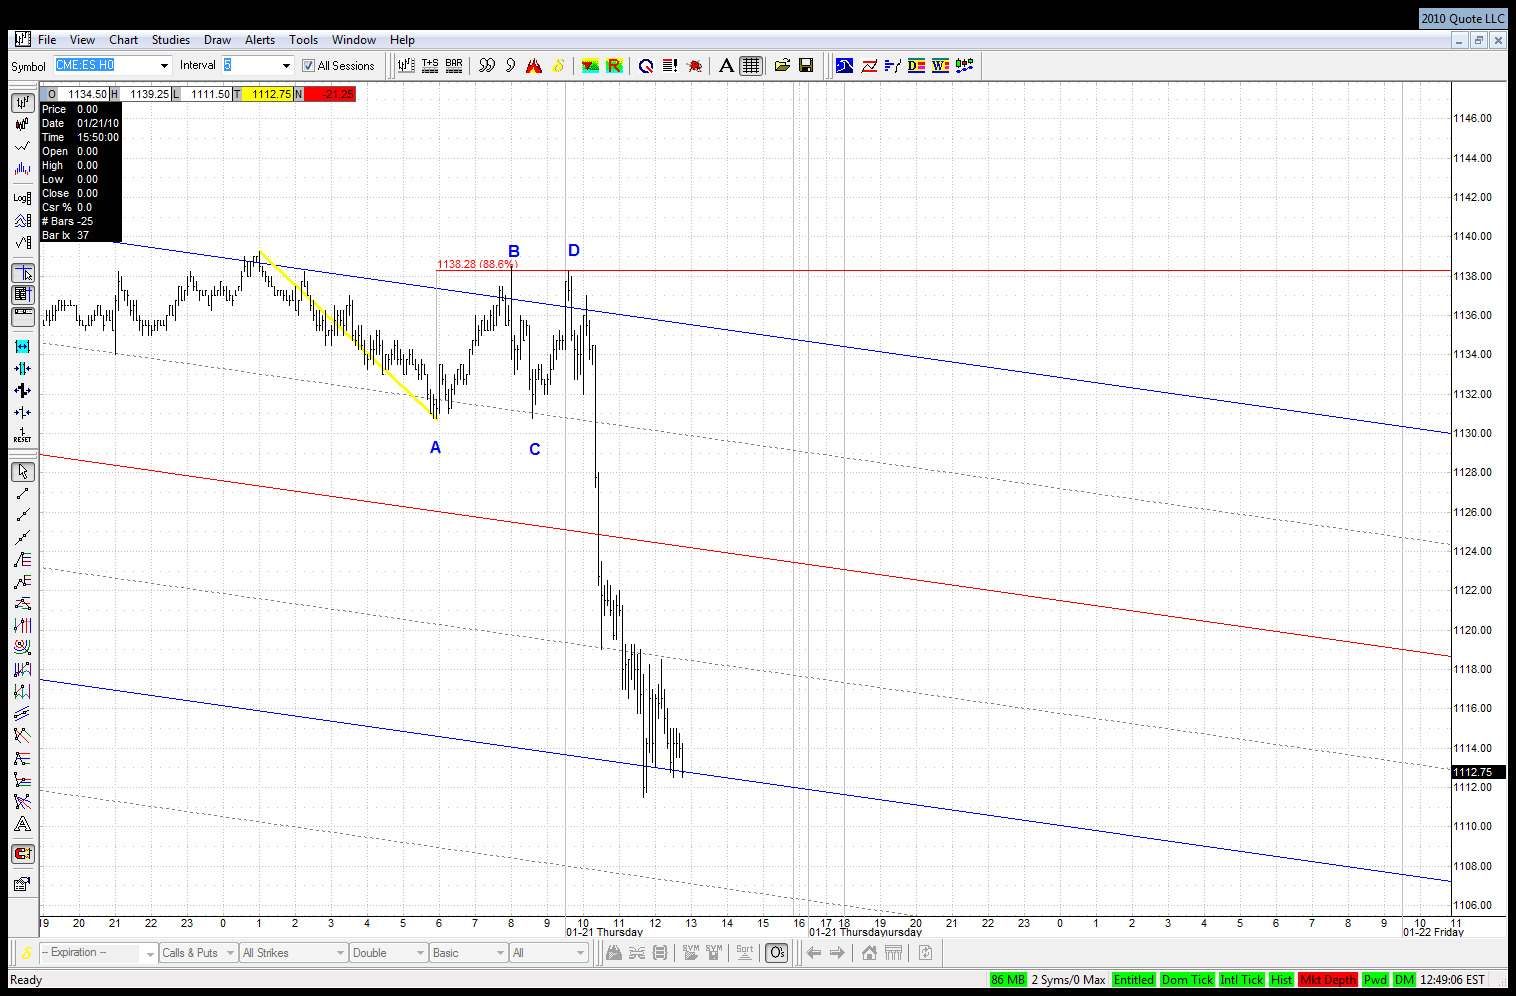
Jim - can we count this as Flat ABCD despite such big retracement of the preceding leg?
Click image for original size
JA
jarek
Rep: 94
Posts: 3,474
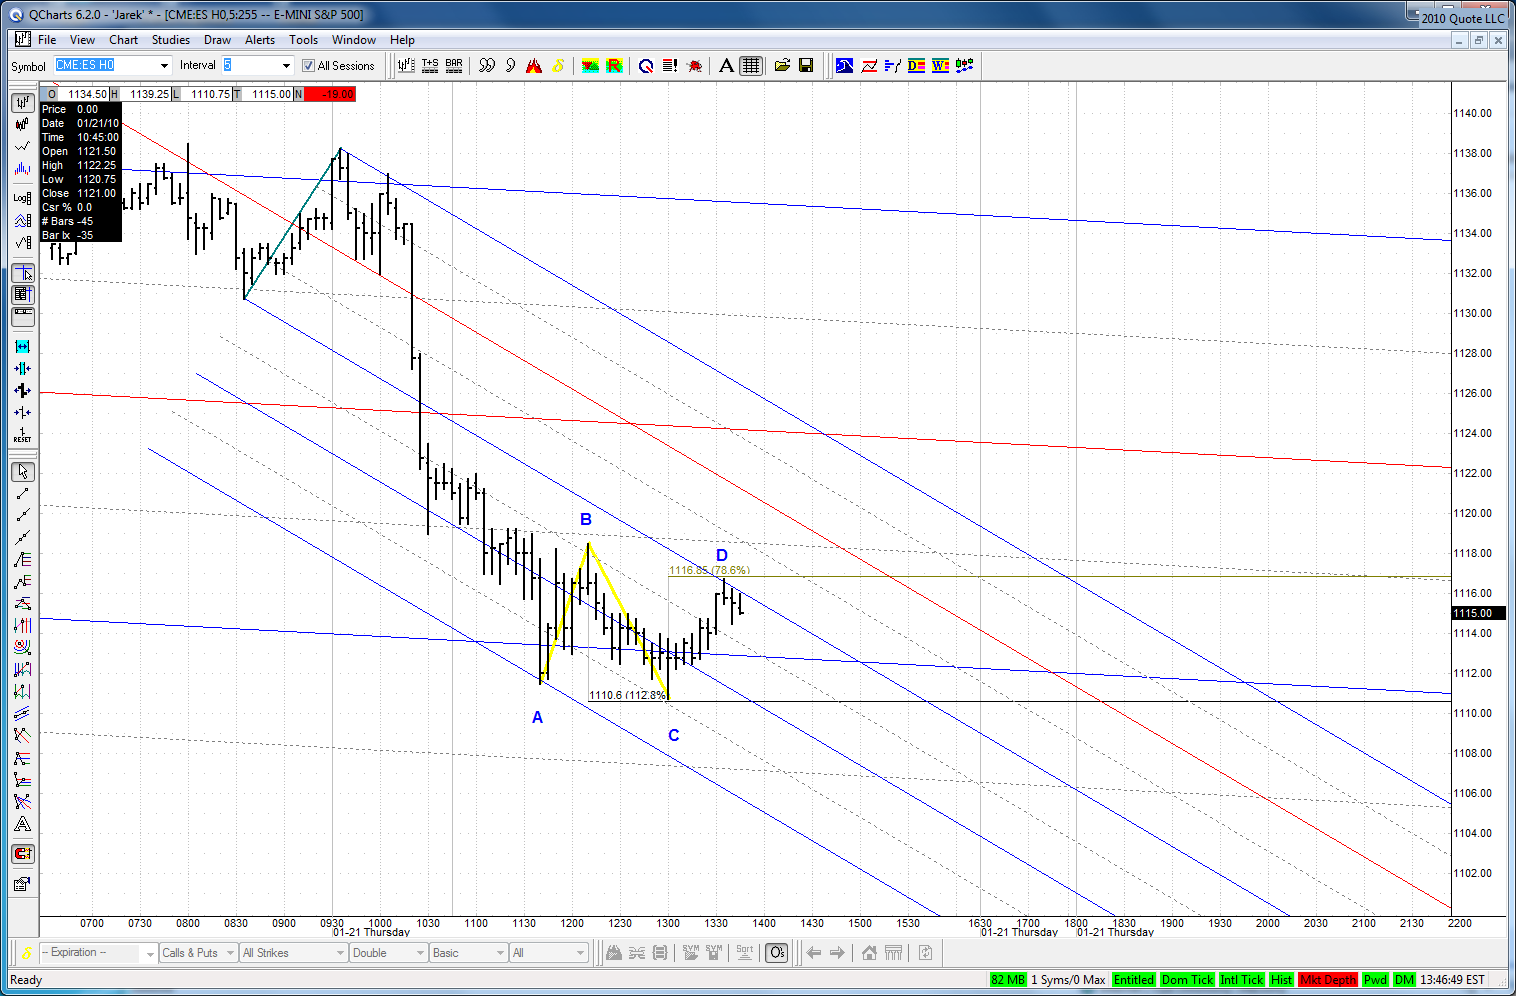
If this TD ABCD was everything the market could muster at the moment then much lower prices lie ahead:
Click image for original size
JI
jimkane
Rep: 3,058
Posts: 33,089
Nice work, jaerk.
Yes, I still consider that a flat.
And yes, if this can't get above this critical spot, it's in a lot of trouble. It should bounce in here, or do one more push down off this ABCD in here (or another ABCD in here), and then bounce. If not, that's a huge clue.
Yes, I still consider that a flat.
And yes, if this can't get above this critical spot, it's in a lot of trouble. It should bounce in here, or do one more push down off this ABCD in here (or another ABCD in here), and then bounce. If not, that's a huge clue.
RO
roofer
Rep: 3,689
Posts: 3,574
i hope all grasped what i did... i did not forcast.... i simply used the tools of this forum across all my traders until there was not a single buy signal left... that is when important reversals occur...AT THAT MOMENT IN TIME!!!!, THERE IS SIMPLY NO GEOMETRY LEFT TO SUPPORT THE MARKET....jim is perfectly correct to be looking for ABCD'S.... I AM TOO..but looking across hundreds of charts, i believe price was at or near this years high at the recent high...i have no big ideas of how important this high was based on theoretical constructs.... just trading the tools....as the machine that grinds.