There's not much to add to Jim's yesterday post. I'll refrain from posting here long term setups which are not based on KT methodology.
PS. This might be a good contrarian indicator of a nearby turn :-) DJIA has just completed an ending diagonal almost to the day at 0.618 time retracement of Oct 2007 - Mar 2009 drop
JI
jimkane
Rep: 3,058
Posts: 33,089
Right to my spot, then they went psychotic on it. See if you can find the spot (well, the reason for the spot).
JI
jimkane
Rep: 3,058
Posts: 33,089
Amazing area to area, line to line, setup to setup action. Simply amazing to me...
JA
jarek
Rep: 94
Posts: 3,474
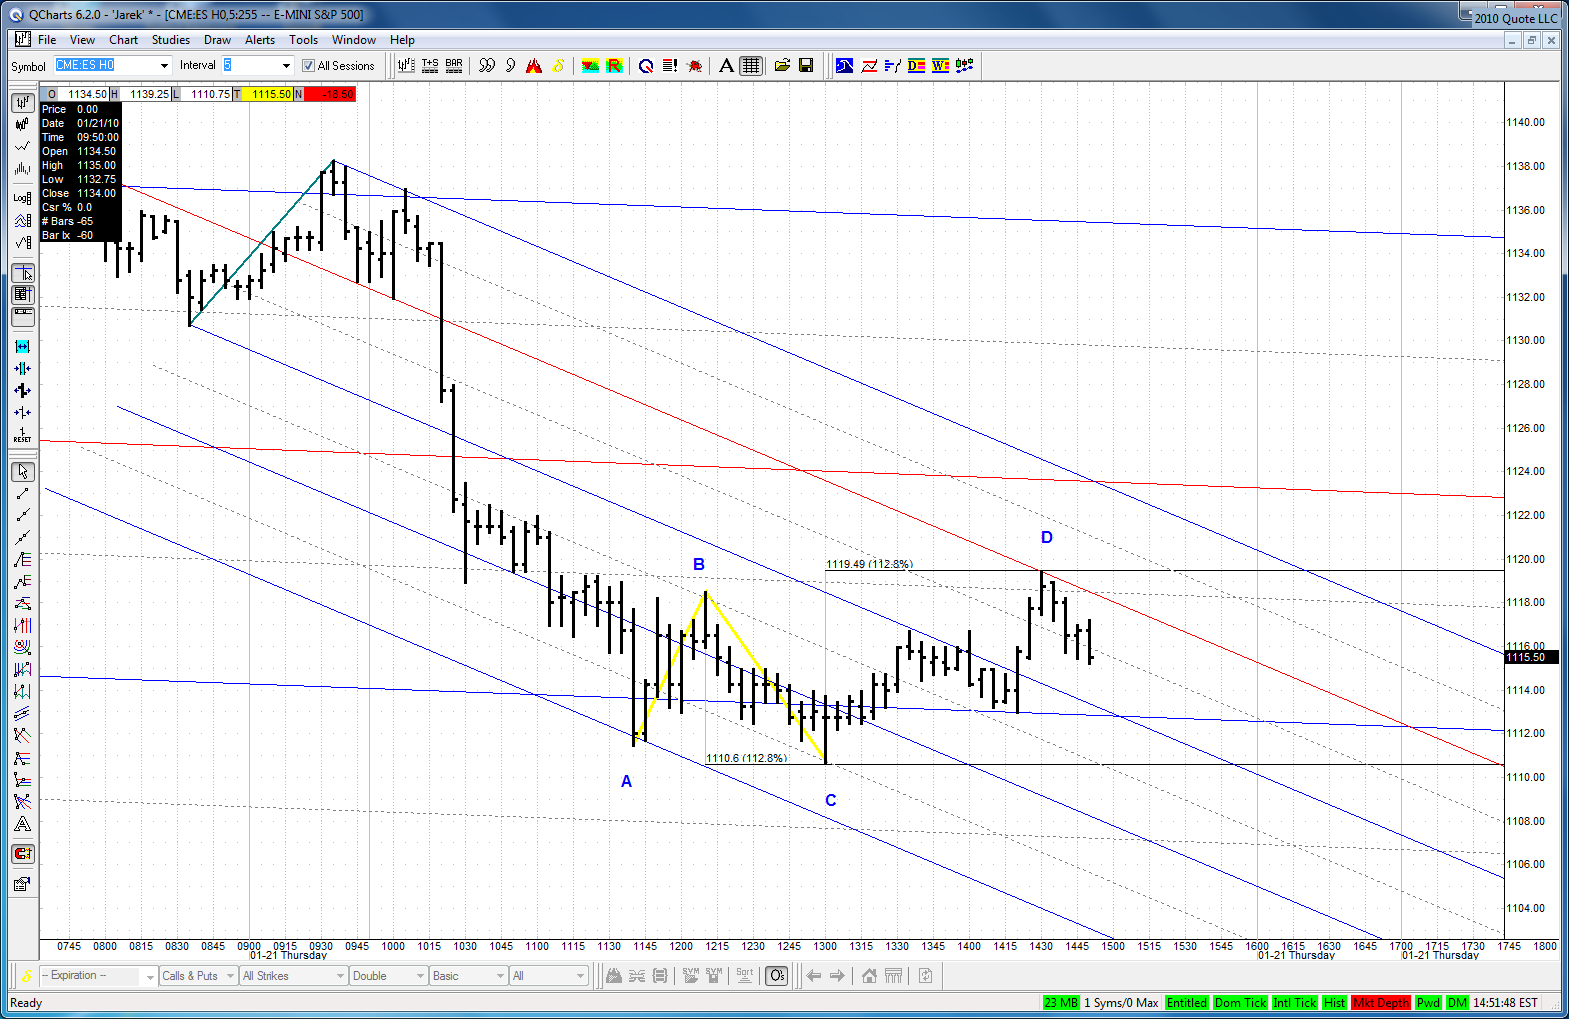
Does this ABCD in CD leg of EXP ABCD not worry you at all?
Click image for original size
JI
jimkane
Rep: 3,058
Posts: 33,089
No, the only time I dislike an ABCD in the CD leg is in a zigzag. It can be quite good in the other variations.
JI
jimkane
Rep: 3,058
Posts: 33,089
I have found that most cases where the 'context' is like this, i.e. a bigger pattern has now formed, a steep, exhaustive drop, and then a 'W4' looking ABCD, they almost never play out to new lows, nor do they usually blow out to the upside right away. They mostly chop in the range of the pattern, up and down, sometimes setting up multiple ABCD's one after another. Then it explodes out of the area, usually on a gap the next day. In this case, I think if it is to go up, this pullback here should be the spot. But, most likely it will chop up and down until the close. Let's see...
JI
jimkane
Rep: 3,058
Posts: 33,089
Okay, watch this .786 (and .886 next) area, and let's see if they plan to do what I mentioned, chop in the ABCD range, or if they really can set a new LOD. The latter sure would be cool, and welcomed, but it would speak for a short-term exhaustion and big bounce, in my opinion. Hence, I'd prefer a more sustainable downtrend. It would also be the exception to the rule for what I usually see in cases like this. Can't wait to see, it sure looks incredibly weak, which isn't what I see in cases where it chops.
JA
jarek
Rep: 94
Posts: 3,474
Originally posted by jimkane
... Then it explodes out of the area, usually on a gap the next day...
Is it a gap down or up?
JI
jimkane
Rep: 3,058
Posts: 33,089
It depends more on where the key support area/pattern hits than anything else, so it can be either way. More commonly I see it up, or against the smaller pattern (down if the layout is reversed).
RO
roofer
Rep: 3,689
Posts: 3,574
i hope all grasped what i did... i did not forcast.... i simply used the tools of this forum across all my traders until there was not a single buy signal left... that is when important reversals occur...AT THAT MOMENT IN TIME!!!!, THERE IS SIMPLY NO GEOMETRY LEFT TO SUPPORT THE MARKET....jim is perfectly correct to be looking for ABCD'S.... I AM TOO..but looking across hundreds of charts, i believe price was at or near this years high at the recent high...i have no big ideas of how important this high was based on theoretical constructs.... just trading the tools....as the machine that grinds.