There's not much to add to Jim's yesterday post. I'll refrain from posting here long term setups which are not based on KT methodology.
PS. This might be a good contrarian indicator of a nearby turn :-) DJIA has just completed an ending diagonal almost to the day at 0.618 time retracement of Oct 2007 - Mar 2009 drop
JA
jarek
Rep: 94
Posts: 3,474
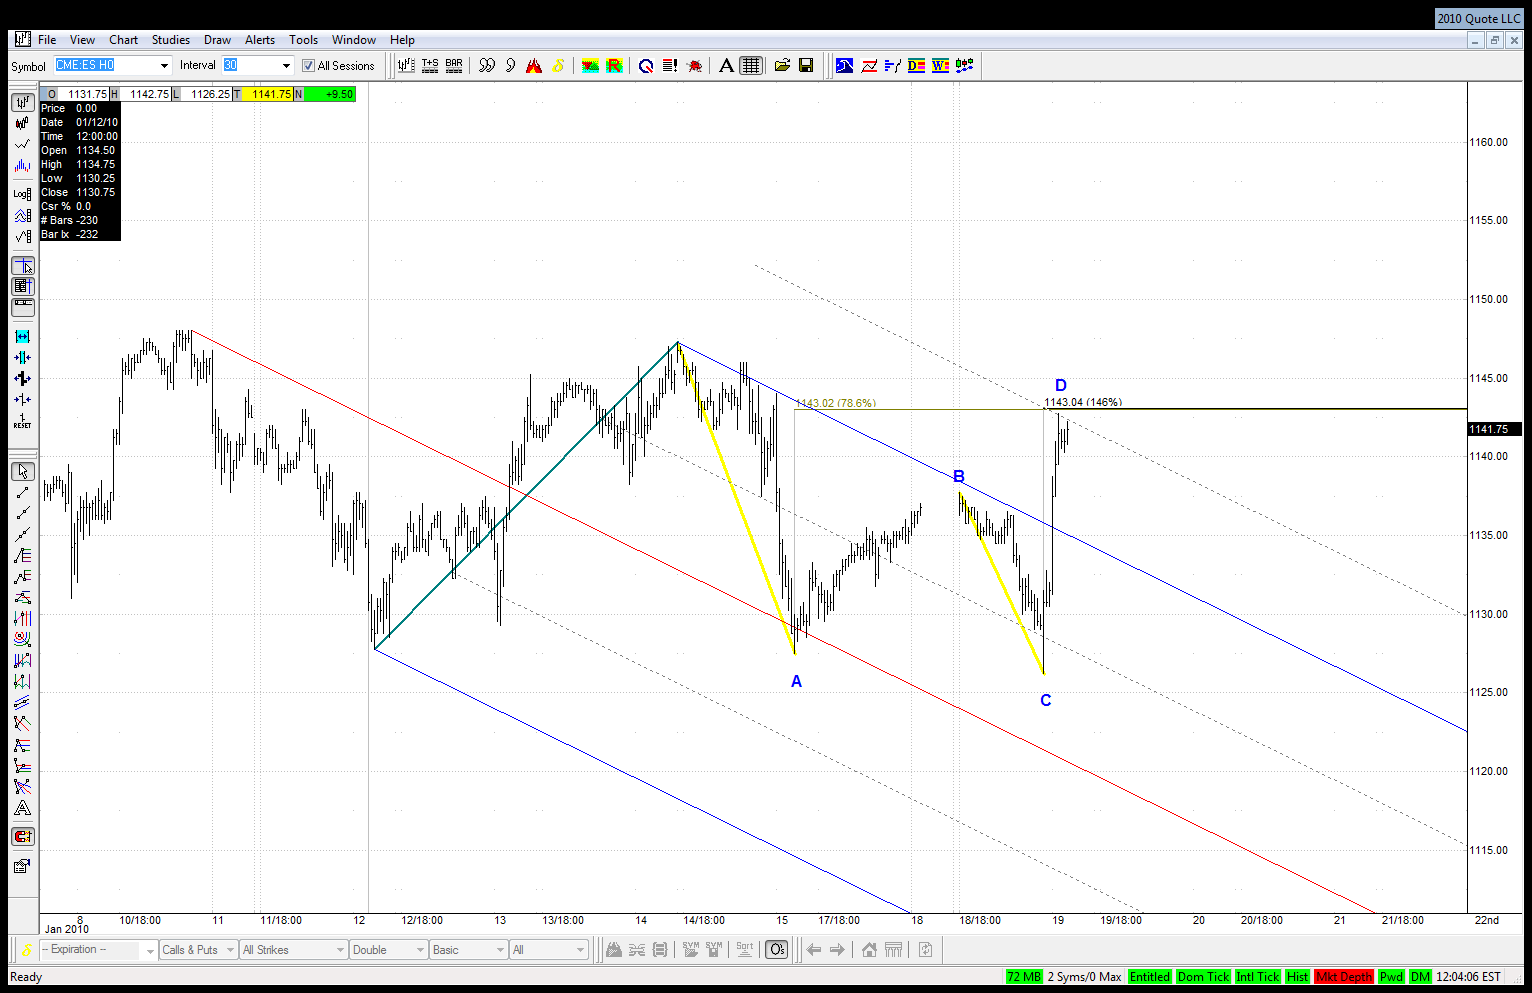
Since today's Globex drop fell below Friday's low, the move up of that flat ABCD mentioned by Jim is rather finished. The only potential ABCD I see right now is the following DB ABCD:
Click image for original size
JI
jimkane
Rep: 3,058
Posts: 33,089
My view here on the flat ABCD is different than jarek's. Look at the ES without GLOBEX, look at any cash chart ($SPX, $RUT, $MID, $COMPQ, $NDX, etc.). I think one little stab fake shake out down in the illiquid GLOBEX doesn't change this at all. The Russell index is now one point from a new 'bull market' high, the INDU five points, the $SPX less than two points. I'd say the pattern has done its thing once again. Remember, spririt of the pattern, not rigid application with unbendable rules. The market is fluid, and 'context' applies in many different areas, including 'spirit' of a pattern.
JI
jimkane
Rep: 3,058
Posts: 33,089
I don't want this to sound like a 'pick on jarek' fest here, so I hope he has a thick skin and can take my comments :-) Anyone who posts in here with the objective of learning my methodology as I have created it should welcome constructive comments on their work. The issues I have with the DB ABCD in that last chart are twofold.
The first is, I try to not do ABCD's in sideways, congestion-like price action. I have seen price move in a range and follow one ABCD after another through that phase, and I know T has done a lot of work on this, finding various combinations of ABCD's, and how they fit with each other, but it's not my style. I like trend/correction/trend/correction/... This last flat was a correction to a strong uptrend.
Second, this ABCD as shown here could be a 'W2' setup if that was a top, but then it's back to was this a top right there at that last high? It may be, but the odds don't favor it for me, as I have said before, so I don't want to trade a 'W2' here to bet on it. It may be, but I won't play it. Also, it doesn't fit with what all the cash charts show.
Now, are we back to a possible sideways range, like most of last Nov and Dec, and another drop overdue? Possibly. I'm sure roofer is lining up his setups for the short side, ready to go. I know I am. But for now I am going to see what this does from here first.
JA
jarek
Rep: 94
Posts: 3,474
I have no problem with being on the wrong side at all and I welcome all your comments :-) My ending diagonal count was invalidated right after the open since it required a straight drop to the red line which simply didn't happen. So at the moment I'm not short side biased at all. And I was curious to see how you would interpret this Globex breach of the low. You may notice that I wrote that the move up was rather finished.
JI
jimkane
Rep: 3,058
Posts: 33,089
I'd like to understand more of your interpretation on this one, jarek. I look at the GLOBEX move, as compared to cash, which also is supported by most of the stocks I checked, as a 'spurious' move, and doesn't change the flat at all for me. Hence, I am expecting, on average, a move at least to the 1.272 at new highs. That nominal new low, even if present in all the cash markets, wouldn't change my view on the most probable area it will reach. I'm curious as to why that move changes your view on how far this may go?
JI
jimkane
Rep: 3,058
Posts: 33,089
There's another set line that comes in close to here, and with the DB ABCD jarek pointed out, it sure is struggling with that. Keep in mind, and as T has shown with his work, that may well drive this down. I just wanted to be clear, as my 'long' posts lately have said, I am not going to play this more than 'line to line' here. I am not going to try to pick the top for a longer-term play. There will be plenty of time for that.
JI
jimkane
Rep: 3,058
Posts: 33,089
In the meantime, though, until it gives me something, I'll stay long side, waiting for that new 'bull market' high...
JA
jarek
Rep: 94
Posts: 3,474
Originally posted by jimkane
I'd like to understand more of your interpretation on this one, jarek. ... That nominal new low, even if present in all the cash markets, wouldn't change my view on the most probable area it will reach. I'm curious as to why that move changes your view on how far this may go?
Would you still stick to your target for the move off an ABCD if the first thrust up from the area would have been retraced more than 100% during cash markets?
RO
roofer
Rep: 3,689
Posts: 3,574
i hope all grasped what i did... i did not forcast.... i simply used the tools of this forum across all my traders until there was not a single buy signal left... that is when important reversals occur...AT THAT MOMENT IN TIME!!!!, THERE IS SIMPLY NO GEOMETRY LEFT TO SUPPORT THE MARKET....jim is perfectly correct to be looking for ABCD'S.... I AM TOO..but looking across hundreds of charts, i believe price was at or near this years high at the recent high...i have no big ideas of how important this high was based on theoretical constructs.... just trading the tools....as the machine that grinds.