There's not much to add to Jim's yesterday post. I'll refrain from posting here long term setups which are not based on KT methodology.
PS. This might be a good contrarian indicator of a nearby turn :-) DJIA has just completed an ending diagonal almost to the day at 0.618 time retracement of Oct 2007 - Mar 2009 drop
JI
jimkane
Rep: 3,058
Posts: 33,089
Originally posted by jarekThat's the one I mentioned in the above post yours, for those that weren't sure what I was talking about.
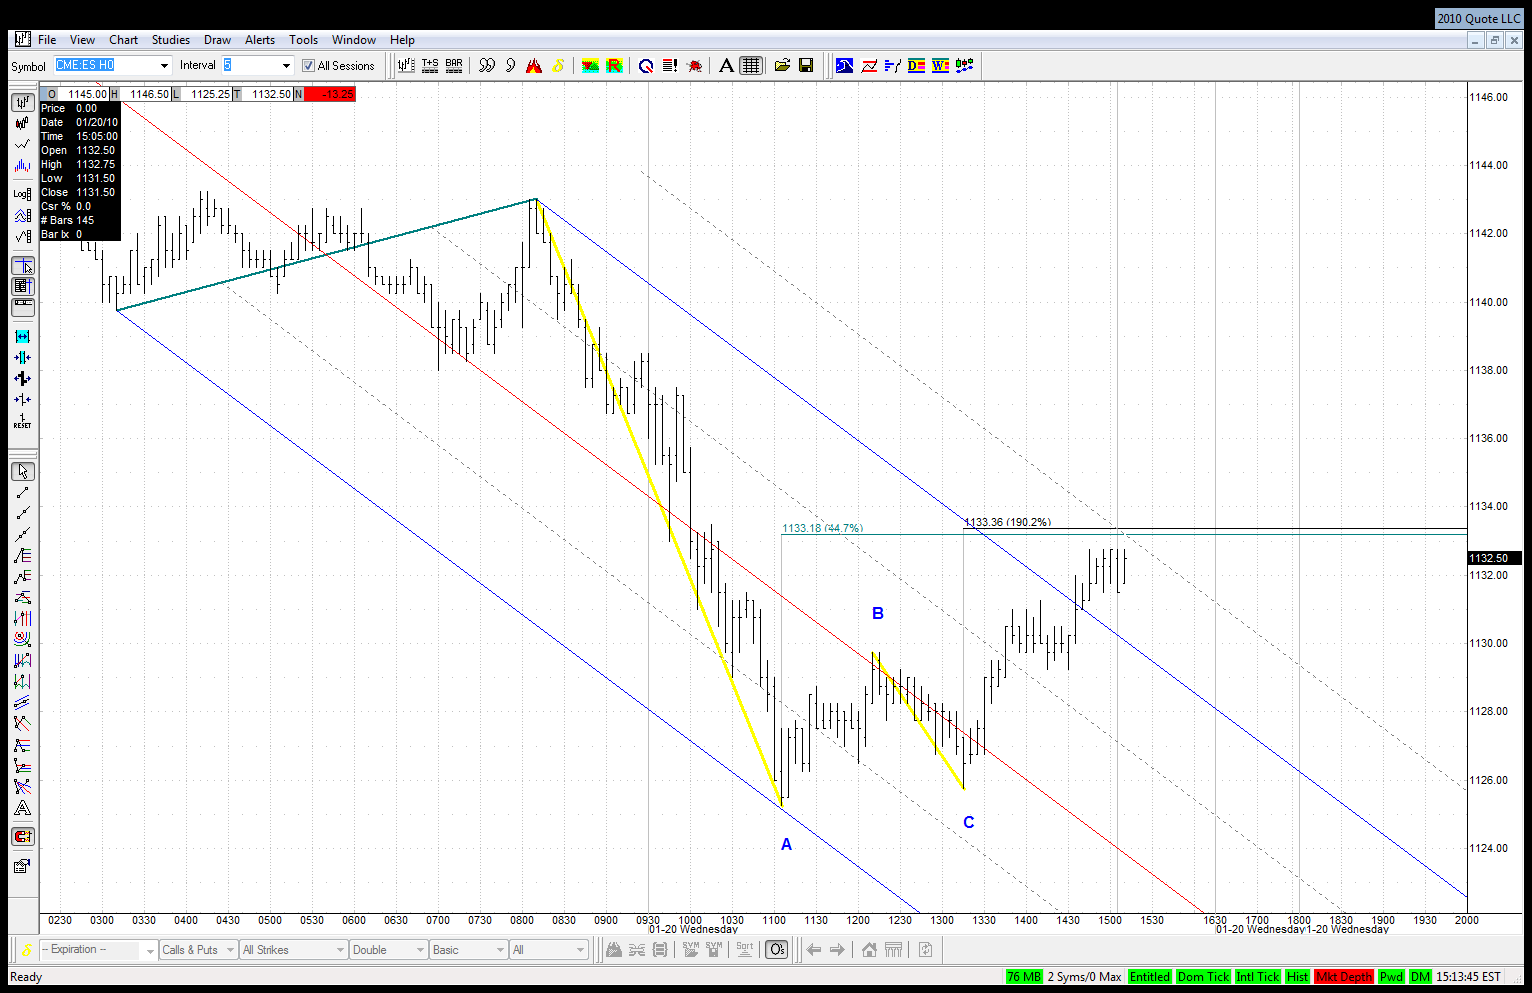
Another ABCD to drive further downside?
JA
jarek
Rep: 94
Posts: 3,474
Are you thinking about this potential setup?
Click image for original size
JI
jimkane
Rep: 3,058
Posts: 33,089
That's what's making me very cautious in here. There is also the .382 off the top in there, too. That's the last spot, in my opinion, before it's nothing left but impulsive up (as far as patterns; it can, of course, roll over at any point at any key line or other area).
JA
jarek
Rep: 94
Posts: 3,474
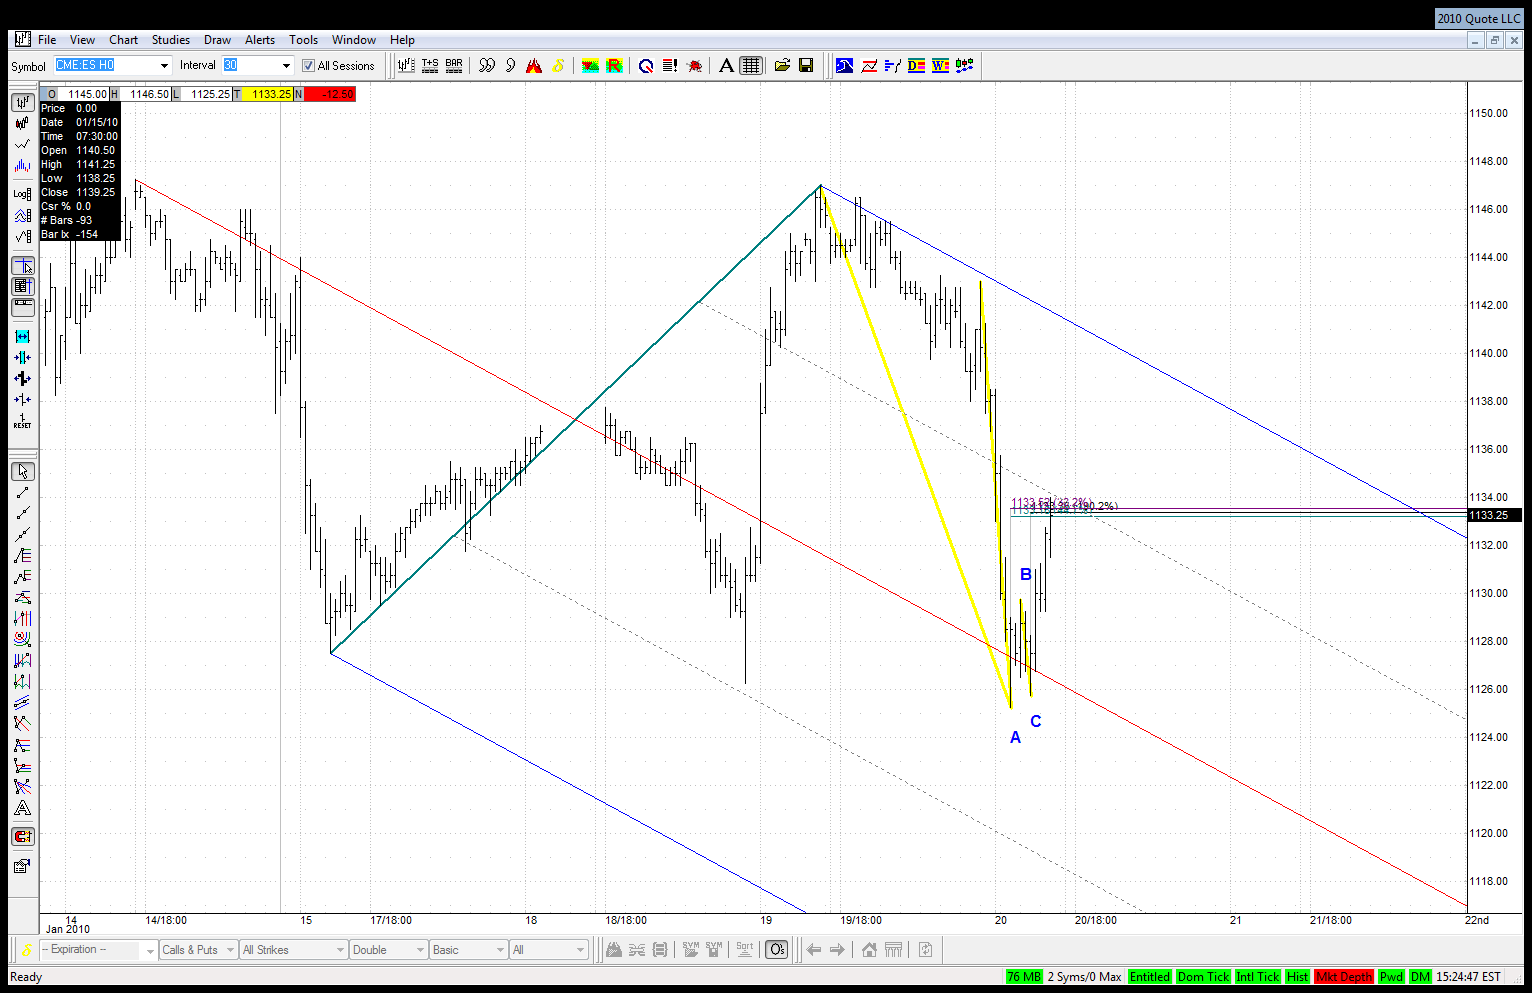
There is also a division line from a natural set in the neighborhood:
Click image for original size
JI
jimkane
Rep: 3,058
Posts: 33,089
All around the support area
the algos chased the shorts
the shorts finally found themselves trapped
Pop! goes the market
the algos chased the shorts
the shorts finally found themselves trapped
Pop! goes the market
RO
roofer
Rep: 3,689
Posts: 3,574
i hope all grasped what i did... i did not forcast.... i simply used the tools of this forum across all my traders until there was not a single buy signal left... that is when important reversals occur...AT THAT MOMENT IN TIME!!!!, THERE IS SIMPLY NO GEOMETRY LEFT TO SUPPORT THE MARKET....jim is perfectly correct to be looking for ABCD'S.... I AM TOO..but looking across hundreds of charts, i believe price was at or near this years high at the recent high...i have no big ideas of how important this high was based on theoretical constructs.... just trading the tools....as the machine that grinds.