There's not much to add to Jim's yesterday post. I'll refrain from posting here long term setups which are not based on KT methodology.
PS. This might be a good contrarian indicator of a nearby turn :-) DJIA has just completed an ending diagonal almost to the day at 0.618 time retracement of Oct 2007 - Mar 2009 drop
JA
jarek
Rep: 94
Posts: 3,474
Quite a decline as for lack of negative economic news. Is the market afraid that after what happened yesterday in Massachusetts Democrats might now throw Bernanke to the lions in order to satisfy the public anger? That could very well be our long awaited shock event
JA
jarek
Rep: 94
Posts: 3,474
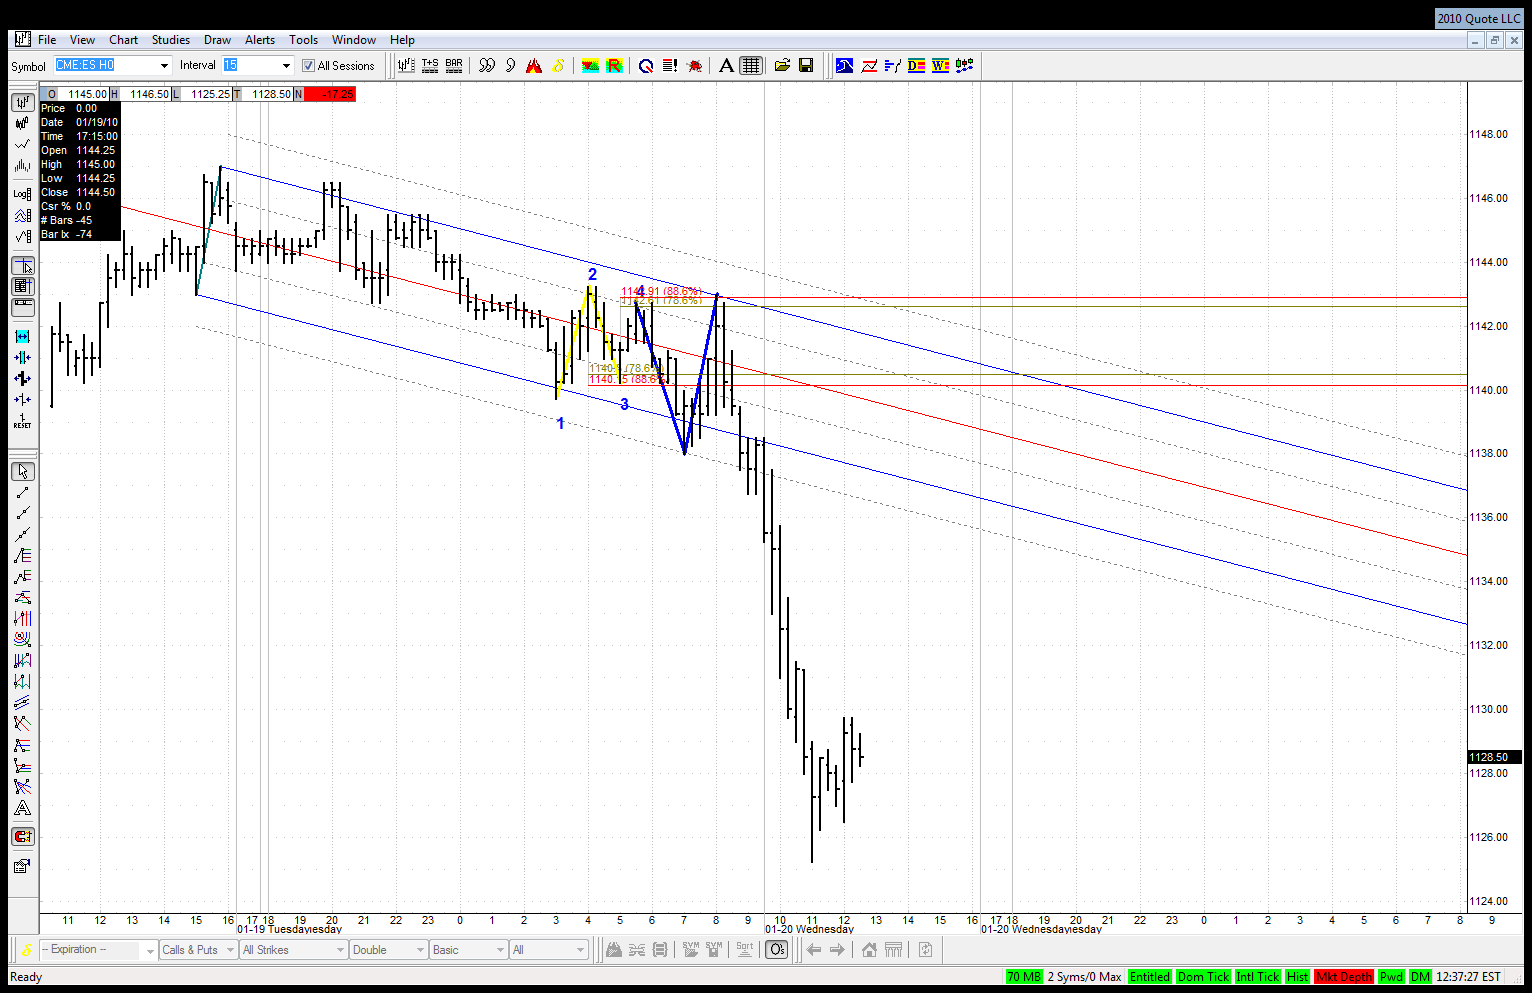
Jim - is this in your opinion another example of W2 retracing more than 100% of W1 after this classic 4PT:
Click image for original size
JI
jimkane
Rep: 3,058
Posts: 33,089
You know, I've been studying how that all unfolded since this morning, and I'm split between that interpretation and the entire thing being a TD B=D ABCD with an ABCD in the BC leg. I think what is important as far as how I see it is that that bounce up, going higher than the previous swing, didn't invalidate the bearish bias, which came from the higher timeframe, as we all discussed yesterday. The immediate price action was only being used for ways in, or add-ons, or management purposes at that point. Nice chartwork.
JI
jimkane
Rep: 3,058
Posts: 33,089
jarek,
Do you have a count starting at point 2, closing the 3 legged move to 38 on the bounce up, and then a new count starting there?
From a practical trading standpoint I'm really only concerned with finding patterns and areas that can get me in along the line of least resistance at any given time, as opposed to counting, but I'm still curious if that's what your interpretation is.
JI
jimkane
Rep: 3,058
Posts: 33,089
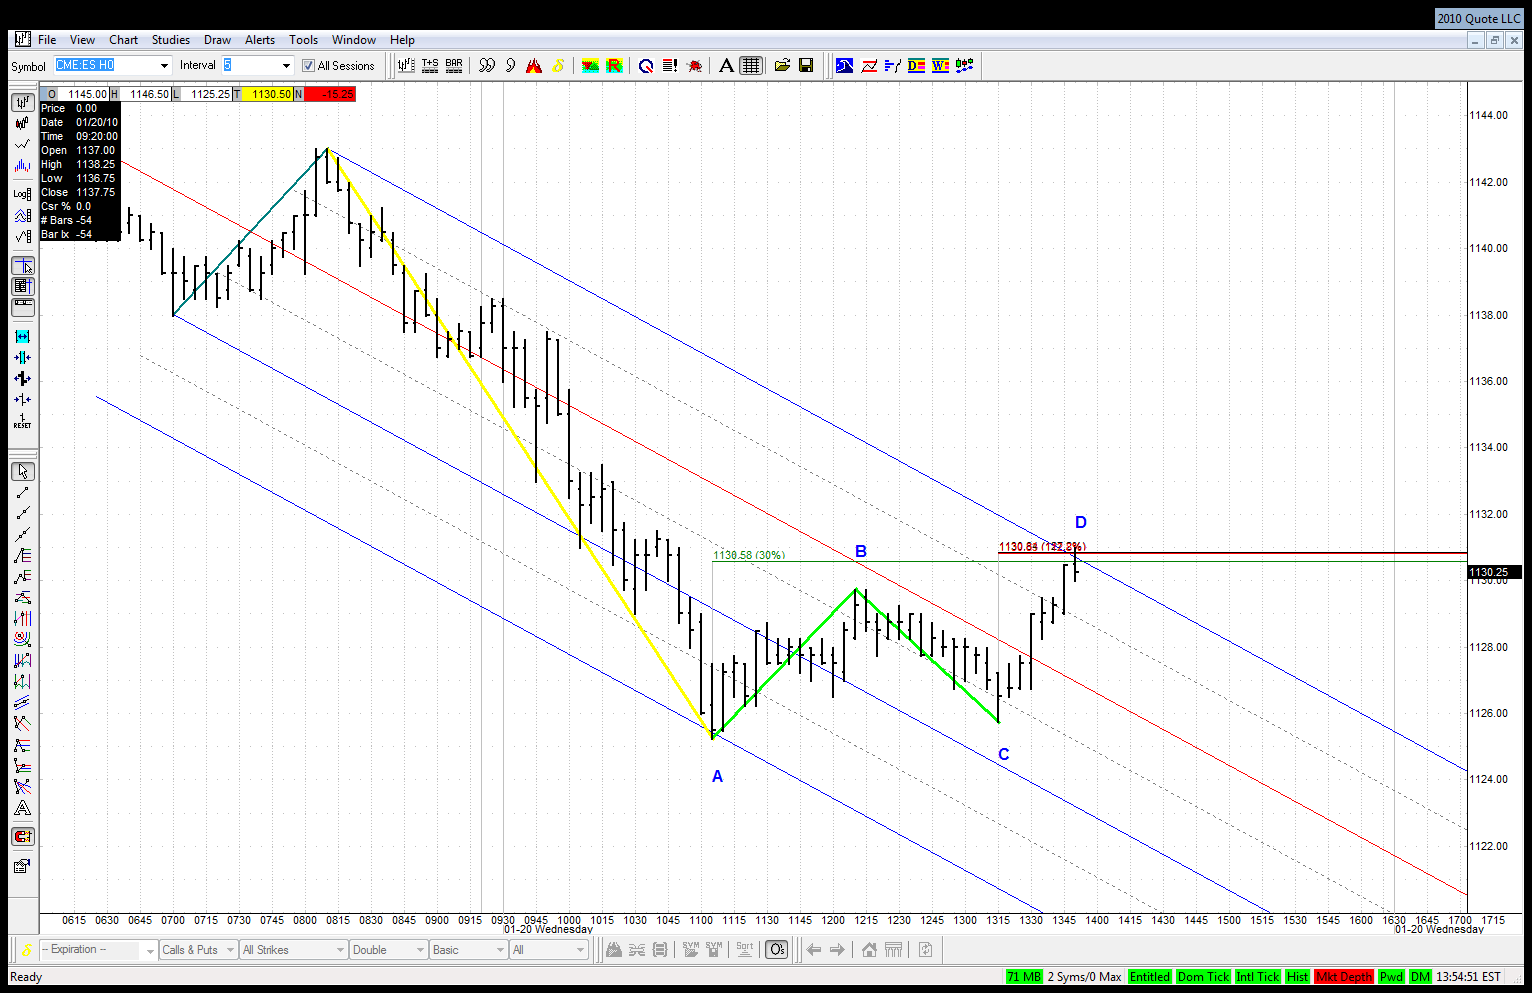
Any takers on support here? Or is everyone ready to see the floor finally go out off this ABCD? Will this ABCD on support be different than the last one, because the top is finally in and 'support' here is not really there?
JA
jarek
Rep: 94
Posts: 3,474
Originally posted by jimkane
jarek,
Do you have a count starting at point 2, closing the 3 legged move to 38 on the bounce up, and then a new count starting there?
In strict Elliott terms this whole move looks like Wave 2 expanding abc correction with point 2 finishing wave a, the move to 38 as wave b and the rise to 43 as wave c.
JA
jarek
Rep: 94
Posts: 3,474
Originally posted by jimkane
Any takers on support here? Or is everyone ready to see the floor finally go out off this ABCD? Will this ABCD on support be different than the last one, because the top is finally in and 'support' here is not really there?
Can we still talk about this flat ABCD? Where would you put its start? On Jan 11th?
JI
jimkane
Rep: 3,058
Posts: 33,089
This is where T shines. He'd call this a blend of two ABCD's, or something of that sort. I don't see this as an ABCD anymore. It could be a flat with an flat ABCD in its BC leg, but I see it as a sideways range now. If I did see it as a flat with a flat in the BC leg, it started Jan 11. Here's where I drop down, as I have been, and look for setups as it goes from support to resistance and back, until it stops doing that. As I've said, I tend to let it run with looser stops when it hits resistance, because of the 'context' of the greater uptrend, and to take it off with tighter stops as it hits support. My style is to do that until 'proven wrong', i.e. the trend is broken by actual price action.
JI
jimkane
Rep: 3,058
Posts: 33,089
Originally posted by jarekYes, that was my second interpretation, I just don't call it an EXP ABCD since the D point wasn't higher than B. And I've got my own name for this exact layout. But, again, from a practical standpoint, the 4PT comes first, and that's the setup I'm looking for (not the 4PT specifically, but any of my setups), and nothing that it did after that would shake me out when the pattern isn't being played for the small move it may produce, but more as an 'entry pattern' for the bigger move back down to support.
Originally posted by jimkane
jarek,
Do you have a count starting at point 2, closing the 3 legged move to 38 on the bounce up, and then a new count starting there?
In strict Elliott terms this whole move looks like Wave 2 expanding abc correction with point 2 finishing wave a, the move to 38 as wave b and the rise to 43 as wave c.
So, no matter what the count, I just know what to look for to get in, where to place my stops, and what I'm trying to accomplish. I'm not putting down Elliott counts or interpretations, more just saying one can see what would get me in, how I would stay with it, what I'm trying to accomplish based on the methodology, and how it played out. That's all I'm ever trying to do.
RO
roofer
Rep: 3,689
Posts: 3,574
i hope all grasped what i did... i did not forcast.... i simply used the tools of this forum across all my traders until there was not a single buy signal left... that is when important reversals occur...AT THAT MOMENT IN TIME!!!!, THERE IS SIMPLY NO GEOMETRY LEFT TO SUPPORT THE MARKET....jim is perfectly correct to be looking for ABCD'S.... I AM TOO..but looking across hundreds of charts, i believe price was at or near this years high at the recent high...i have no big ideas of how important this high was based on theoretical constructs.... just trading the tools....as the machine that grinds.