Current MP Charts
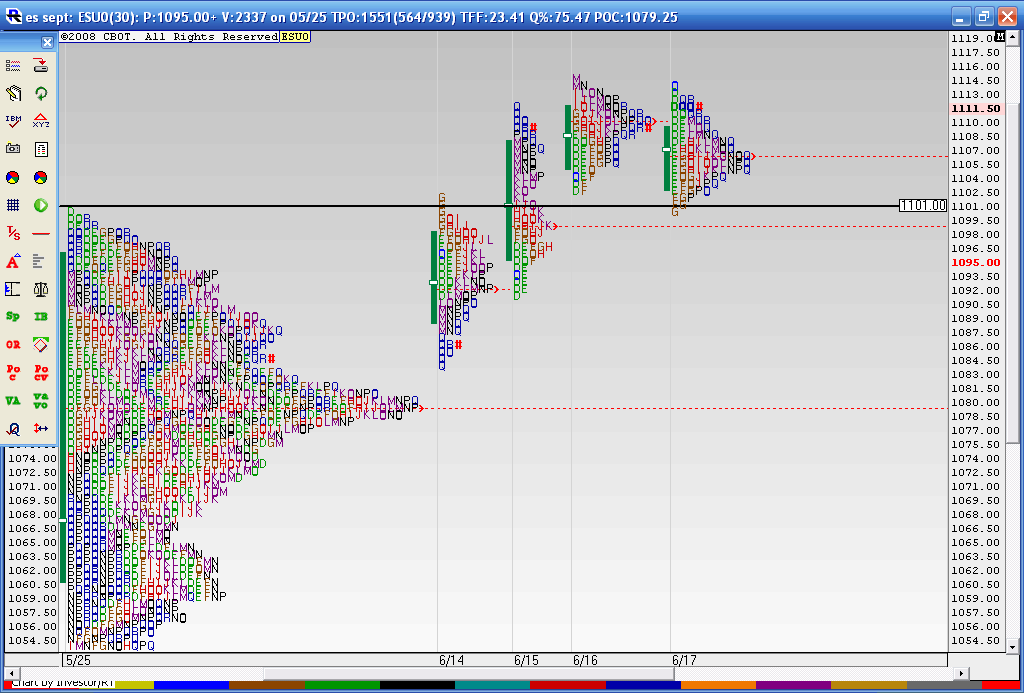
Here is a follow up to a chart I posted. I just don't remember where I posted it..Anyway this shows the Breakout on Monday 6-14 of the composite profile at 1101 and the fact that they held above the big composite node of 1079 - 1080 . Then we went up two more days on 6-15 and 6-16 and today was the first time we had lower price highs and lower Value ( solid green line to the left of the letters). The last three days all have overlapping Value. So we are coiled up and ready to trade for breakouts on Friday.
I also made note of the "bunching " together of the letters in my previous post thinking that a high was in. So I was wrong on that along with all the other cycle folks and market gurus. If this breakout starts to fail then we need to keep a close eye on the breakout point 1101 and of course that high volume node of 1079- 1180. The breakout point was tested today on Thursday and closed just off it's highs. These longer term profiles and my analysis is a work in progress so hopefully this journey will point out some good clues over time. Many are noticing the weakness in Volume and market internals since the breakout of 1101 so that needs to be factored in as we want to know "just how well" we are trending higher. So far I'd have to say not very well!!
I also made note of the "bunching " together of the letters in my previous post thinking that a high was in. So I was wrong on that along with all the other cycle folks and market gurus. If this breakout starts to fail then we need to keep a close eye on the breakout point 1101 and of course that high volume node of 1079- 1180. The breakout point was tested today on Thursday and closed just off it's highs. These longer term profiles and my analysis is a work in progress so hopefully this journey will point out some good clues over time. Many are noticing the weakness in Volume and market internals since the breakout of 1101 so that needs to be factored in as we want to know "just how well" we are trending higher. So far I'd have to say not very well!!
Click image for original size
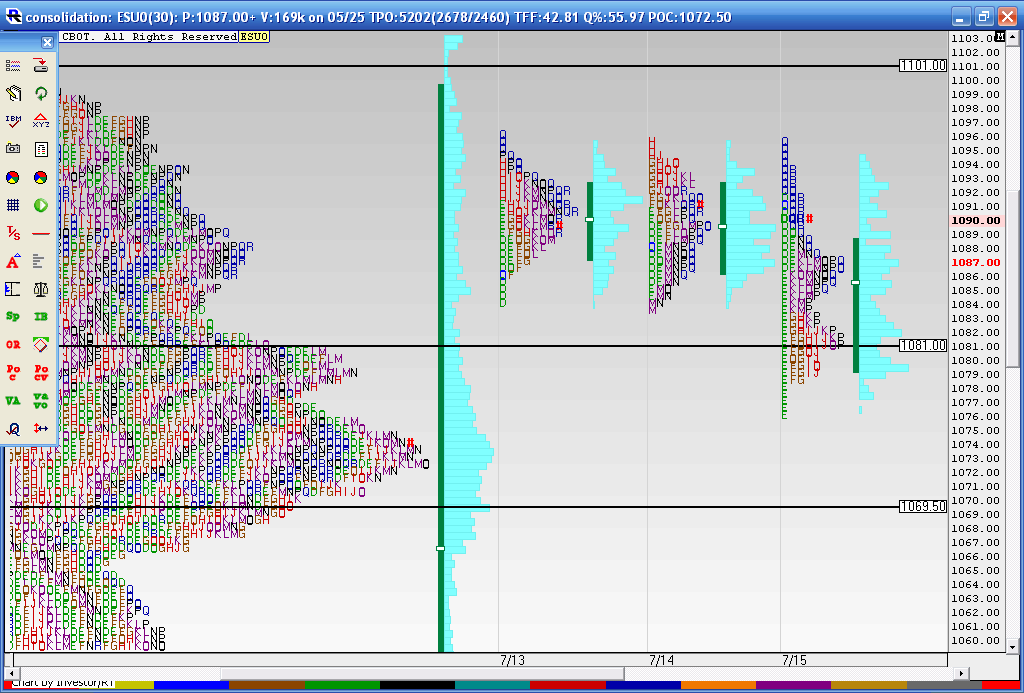
Here is an update. We tested the 1081 area from up higher today and the market closed strong. Is this a sign of a retest of 1101 and higher ? Sure wish I knew. The 8:30 reports will decide that. Everything in context....watch for my next post as it has a chart idea that i'm watching for..
Click image for original size
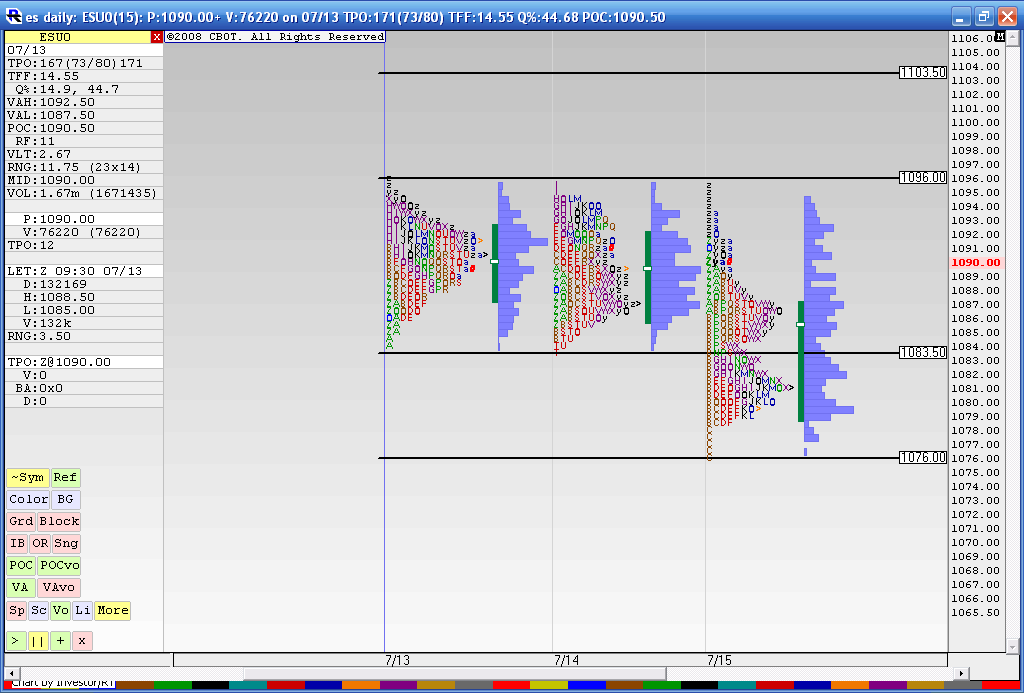
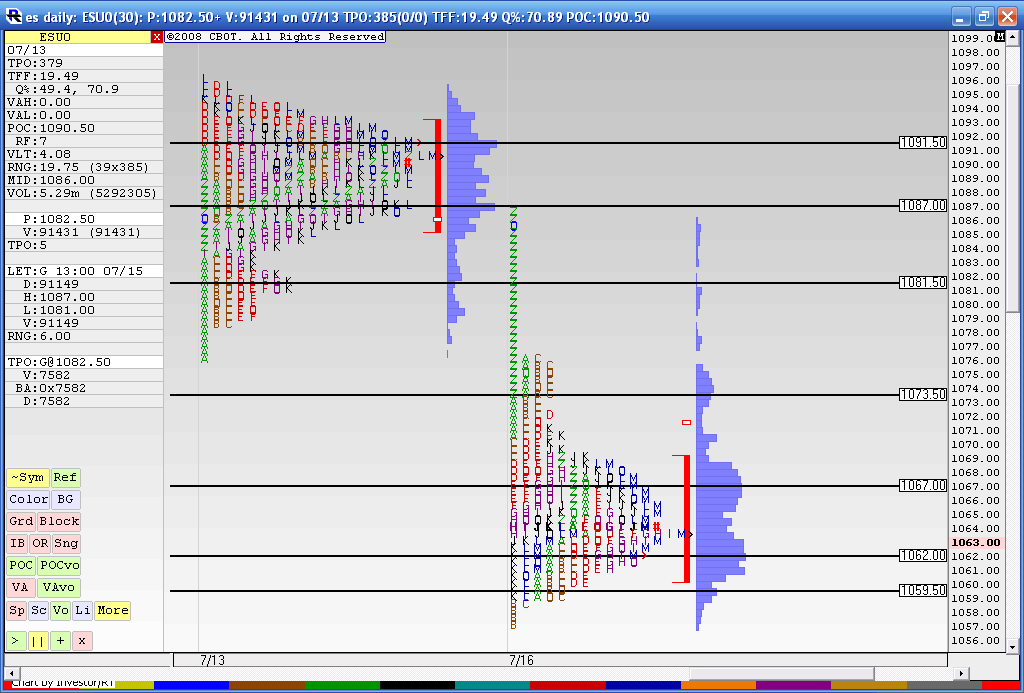
This may be a bit "creative" on my part but today we broke down from two days of overlapping value ( Tuesday and Wednesdays trade)but closed strong. Now to keep it balanced and "even steven" they may try to run it up into the 1103.50 which would be the amount of the breakdown added to the highs. We also have 1101 as a key number !
With that said I also think that if we trade back down below 81 then we should start working our way towards 69 and lower. Here is the "even steven"
With that said I also think that if we trade back down below 81 then we should start working our way towards 69 and lower. Here is the "even steven"
Click image for original size
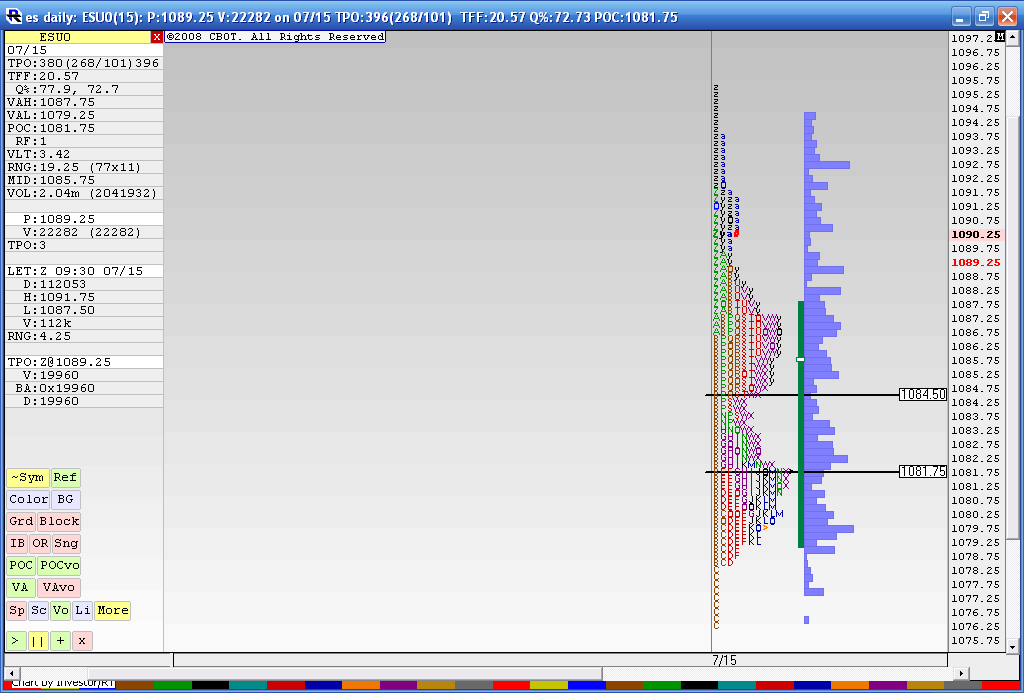
one last thing to watch for especially if you feel the "even steven" isn't going to happen is this pattern. This is Thursdays trade. It looks like an incomplete lower 'b' pattern that needs to be filled in.
So the market may need to spend some time in the 81 - 85 area to fill it in.
So the market may need to spend some time in the 81 - 85 area to fill it in.
Click image for original size
I like your idea for the failed even steven, even though I don't know what the even steven is about. But I see what your saying about how price has to spend time between 81-85 to fill in the b. Maybe a consolidation day before a selloff.
Maybe you can throw up a 6 month chart (until I start the trial for r/t
, it might spark some ideas.
Maybe you can throw up a 6 month chart (until I start the trial for r/t
, it might spark some ideas.
Great charts, either way. Thanks
I just generated a 6 month chart using daily data from 1/19/2010 to 7/15/2010 inclusive. The chart is too big to put on the forum but here are the values from it:
VAH= 1151.25
POC= 1093.25
VAL= 1051.25
I generated using the Market Profile Calculator and dropping in the highs and lows that are in the following file:
VAH= 1151.25
POC= 1093.25
VAL= 1051.25
I generated using the Market Profile Calculator and dropping in the highs and lows that are in the following file:
Click link to access uploaded file:
ESDaily_6months_20100715.xlsx
ESDaily_6months_20100715.xlsx
I think a better look at the 'b' fill in is really 86.50 - 81.50..
I've merged all the profiles together except fridays trade and here is how it looks with the high and low volume numbers labeled
Click image for original size
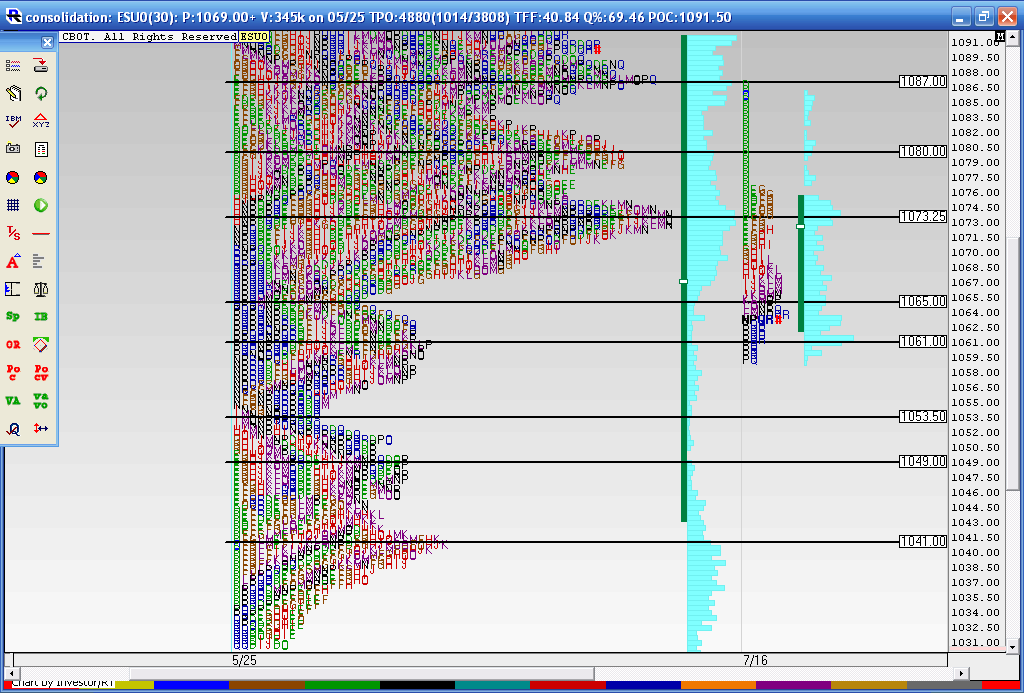
I'm trying a slightly different approach...here I have merged last Tues, wednesday and Thursday and then merged Friday and mondays trading....these are areas where price and value overlapped..
further on the downside under todays lows are the following :
1055
1047.50
1040.25***
1038***
further on the downside under todays lows are the following :
1055
1047.50
1040.25***
1038***
Click image for original size
Originally posted by BruceM
This may be a bit "creative" on my part but today we broke down from two days of overlapping value ( Tuesday and Wednesdays trade)but closed strong. Now to keep it balanced and "even steven" they may try to run it up into the 1103.50 which would be the amount of the breakdown added to the highs. We also have 1101 as a key number !
With that said I also think that if we trade back down below 81 then we should start working our way towards 69 and lower. Here is the "even steven"
Click image for original size
Hi Bruce,
Thanks for posting these charts. They are very useful. It there any chance that you could post this type of chart showing 3 profiles on a daily basis?
Thanks
Notch
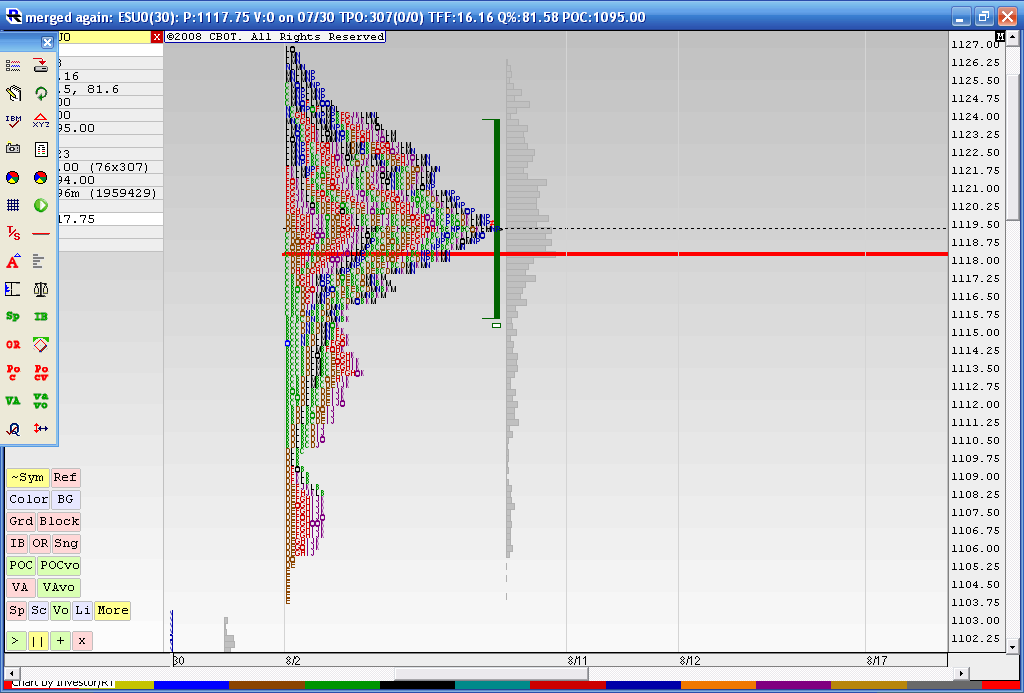
a look at what is trying to hold us back as we travel higher...this is the merged profile from 8-02 thru 8-10
Click image for original size
Emini Day Trading /
Daily Notes /
Forecast /
Economic Events /
Search /
Terms and Conditions /
Disclaimer /
Books /
Online Books /
Site Map /
Contact /
Privacy Policy /
Links /
About /
Day Trading Forum /
Investment Calculators /
Pivot Point Calculator /
Market Profile Generator /
Fibonacci Calculator /
Mailing List /
Advertise Here /
Articles /
Financial Terms /
Brokers /
Software /
Holidays /
Stock Split Calendar /
Mortgage Calculator /
Donate
Copyright © 2004-2023, MyPivots. All rights reserved.
Copyright © 2004-2023, MyPivots. All rights reserved.