Current MP Charts
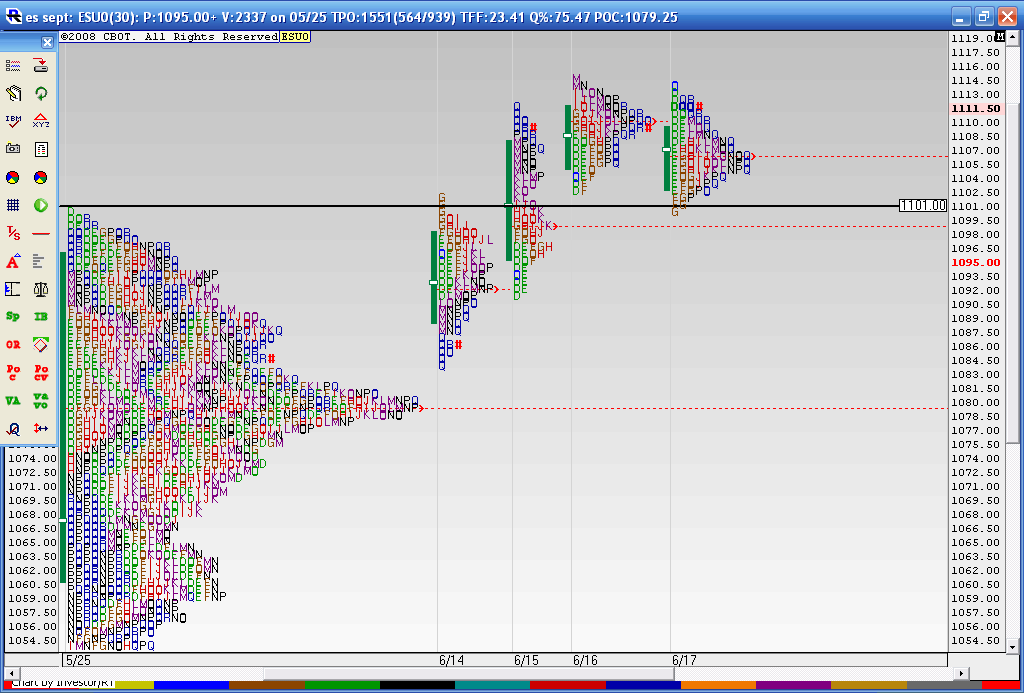
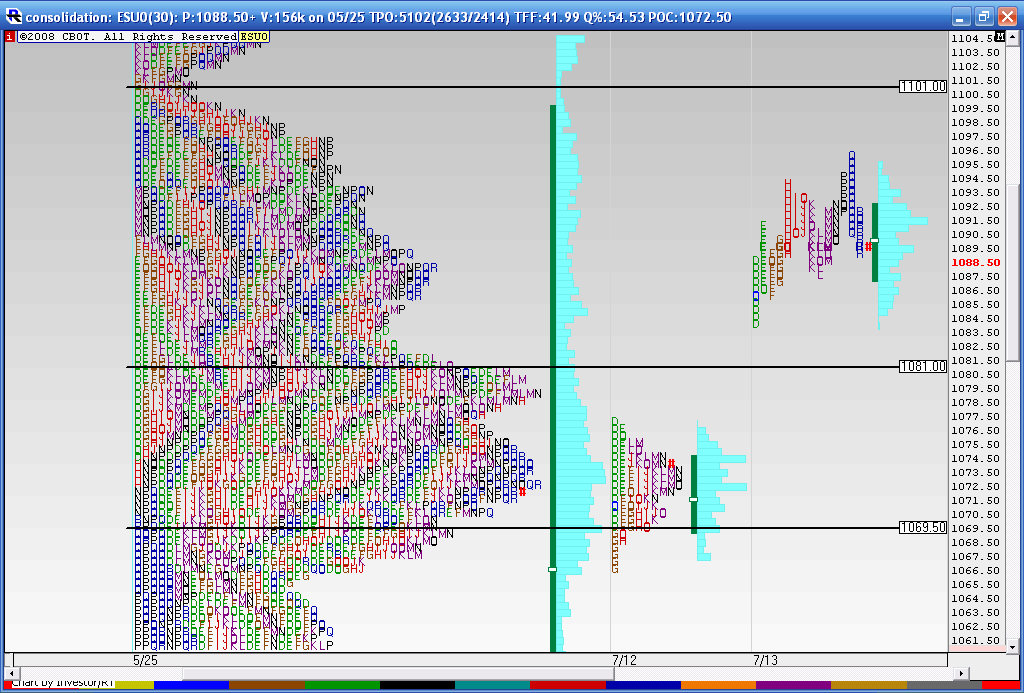
Here is a follow up to a chart I posted. I just don't remember where I posted it..Anyway this shows the Breakout on Monday 6-14 of the composite profile at 1101 and the fact that they held above the big composite node of 1079 - 1080 . Then we went up two more days on 6-15 and 6-16 and today was the first time we had lower price highs and lower Value ( solid green line to the left of the letters). The last three days all have overlapping Value. So we are coiled up and ready to trade for breakouts on Friday.
I also made note of the "bunching " together of the letters in my previous post thinking that a high was in. So I was wrong on that along with all the other cycle folks and market gurus. If this breakout starts to fail then we need to keep a close eye on the breakout point 1101 and of course that high volume node of 1079- 1180. The breakout point was tested today on Thursday and closed just off it's highs. These longer term profiles and my analysis is a work in progress so hopefully this journey will point out some good clues over time. Many are noticing the weakness in Volume and market internals since the breakout of 1101 so that needs to be factored in as we want to know "just how well" we are trending higher. So far I'd have to say not very well!!
I also made note of the "bunching " together of the letters in my previous post thinking that a high was in. So I was wrong on that along with all the other cycle folks and market gurus. If this breakout starts to fail then we need to keep a close eye on the breakout point 1101 and of course that high volume node of 1079- 1180. The breakout point was tested today on Thursday and closed just off it's highs. These longer term profiles and my analysis is a work in progress so hopefully this journey will point out some good clues over time. Many are noticing the weakness in Volume and market internals since the breakout of 1101 so that needs to be factored in as we want to know "just how well" we are trending higher. So far I'd have to say not very well!!
Click image for original size
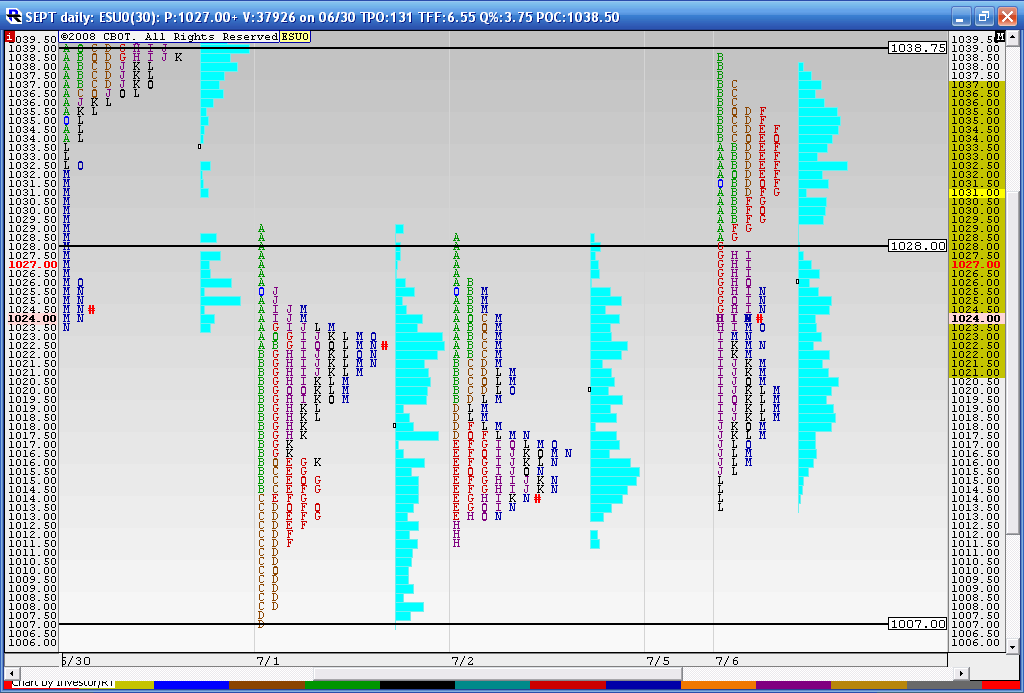
The other day I mentioned the spike at the 39 area...today we traded up above the previous two days highs and then stopped at the spike high and sold off...
Today also left single prints in the 1027.50 - 28 area...and we made a higher value area placement...so the question I'm asking myself is
"Is this the pause before we make new lows below 1006 or are we consolidating to move higher"
Hopefully tomorrows open and On trade will give us some clues,,,
Here is the chart from the spike day forward...
Click image for original size
I hope most realize that what I post here can be vastly different then how I actually trade. This thread is more of a journey for me to find out if I can uncover anything useful from looking at longer term profiles.
I like the results so far with what plays out but I am disappointed in my abilty to keep an open mind and switch gears away from my fader mentality. Today was a trend day that broke the key single prints in the first few minutes of trading but that didn't stop me from fading at certain points. Today was a net loser for me and for those who want to see the failed trades you can see the ES threads.
On the positive side I am becoming a better loser and finally learning to be more selective with fade trades in the afternoon.
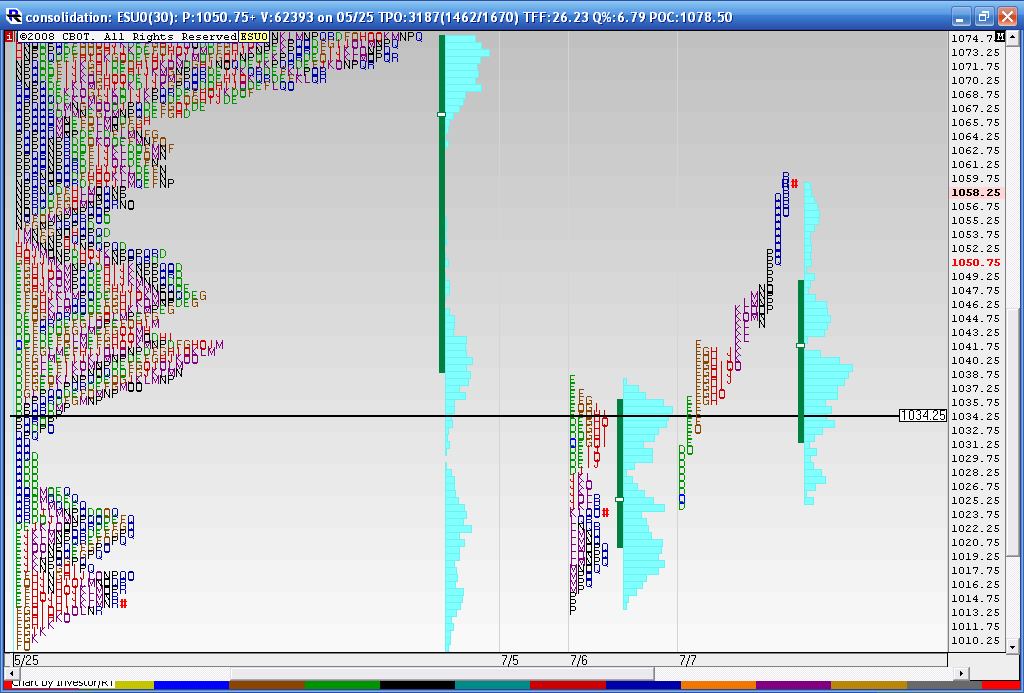
Here is todays chart. I mentioned last night that we could trade to 1061 as that was the center of the range....(midpoint of 1006 and 1128)and while we didn't get there in the day session the current O/N high is 1062.25....so we need to pat ourselves on the back even if we didn't get the long trade today.
Looking at todays action , notice how we consolidated in periods "F,G,H and I" above our key 34 area but also above yesterdays Value area high. I mentioned that in the chat room but still attempted shorts. Ok, nuff said about my demons for now.
Going forward we need to watch the 39 - 41.50 zone as that is key support
I like the results so far with what plays out but I am disappointed in my abilty to keep an open mind and switch gears away from my fader mentality. Today was a trend day that broke the key single prints in the first few minutes of trading but that didn't stop me from fading at certain points. Today was a net loser for me and for those who want to see the failed trades you can see the ES threads.
On the positive side I am becoming a better loser and finally learning to be more selective with fade trades in the afternoon.
Here is todays chart. I mentioned last night that we could trade to 1061 as that was the center of the range....(midpoint of 1006 and 1128)and while we didn't get there in the day session the current O/N high is 1062.25....so we need to pat ourselves on the back even if we didn't get the long trade today.
Looking at todays action , notice how we consolidated in periods "F,G,H and I" above our key 34 area but also above yesterdays Value area high. I mentioned that in the chat room but still attempted shorts. Ok, nuff said about my demons for now.
Going forward we need to watch the 39 - 41.50 zone as that is key support
Click image for original size
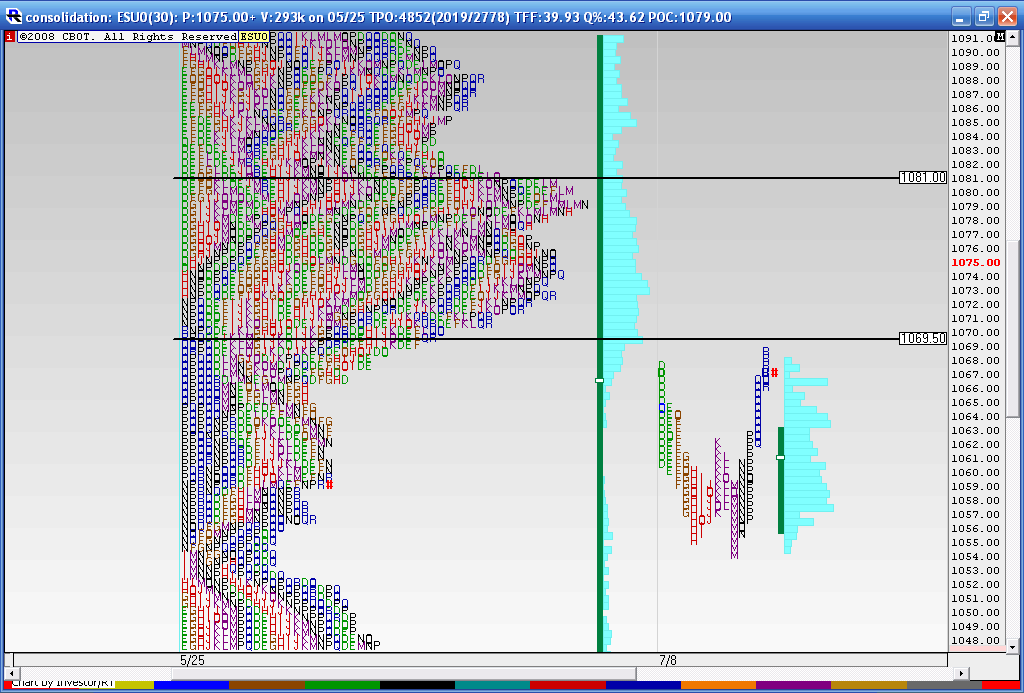
here is the consolidation we need to be aware of for resistance now...we have 62.25 and the 73 - 75 area that started this drop in the O/N session..we also seem to have a volume spike in the 69 price..
Click image for original size
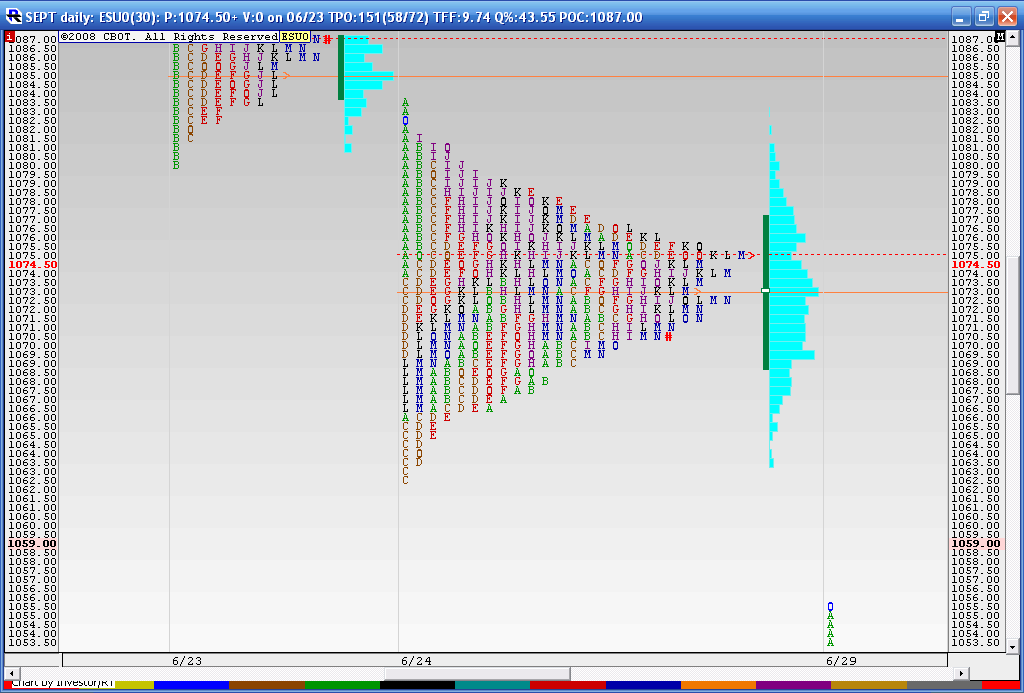
Today we had a late day rally which bounced up close to the 69 number...here is the composite from 5-25 and todays trading seperated out . The volume histogram is a bit off on the composite due to me rolling this over to the September contract. So we can fall back on the TPO's and we are bumping up against lots of them up here. So I created a big ( relatively speaking ) zone of 69 - 81. It will be interesting to see what the overnight brings. Kools tools are calling for a cycle top but the seasonals are strong for the next few days. So us MP folks are looking at this huge cluster to sell against.
Click image for original size
some other numbers based on the recent days that may offer support..
63 - 64
57-59
48 - 50
1039 - 1042 ***** breakout point and single prints
Volume was much lighter and the range was much smaller....so the smart money may have been legging out today...as no follow through from the trend. On the flip side we didn't sell off either.
63 - 64
57-59
48 - 50
1039 - 1042 ***** breakout point and single prints
Volume was much lighter and the range was much smaller....so the smart money may have been legging out today...as no follow through from the trend. On the flip side we didn't sell off either.
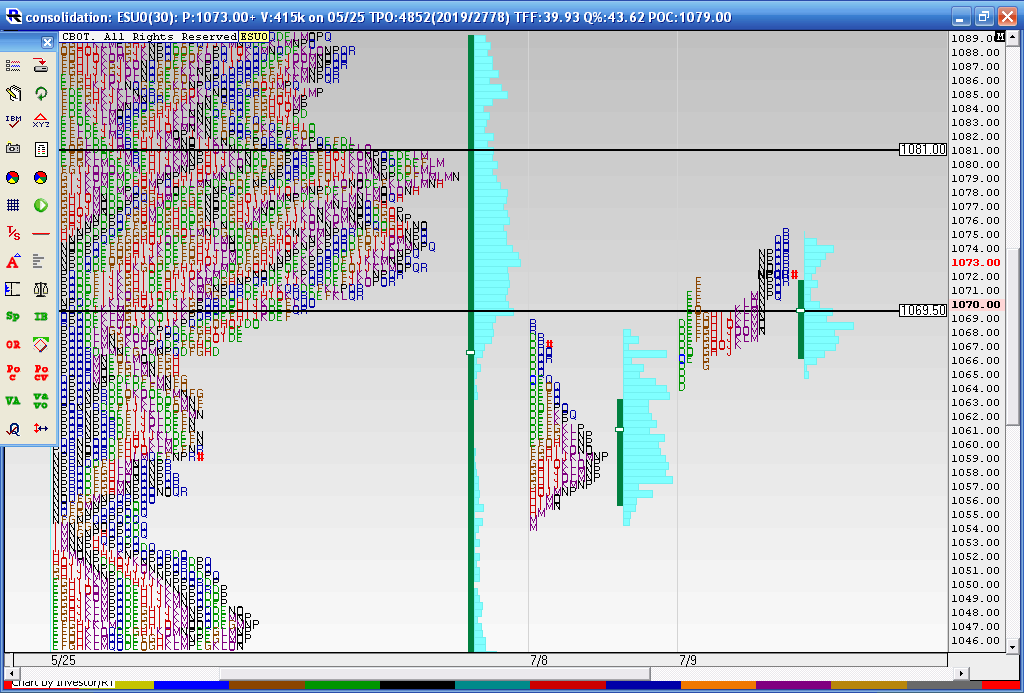
well the 63 - 64 held as support on Friday and we are further up into the key zone on even lower volume than Thursdays trade and lower range. A big move should be coming but which way ? These lower ranges bring all our numbers in closer so we need to still be aware of that 69 area and Friday's high of 75 as that is where this down move started. Here is the MP chart
Click image for original size
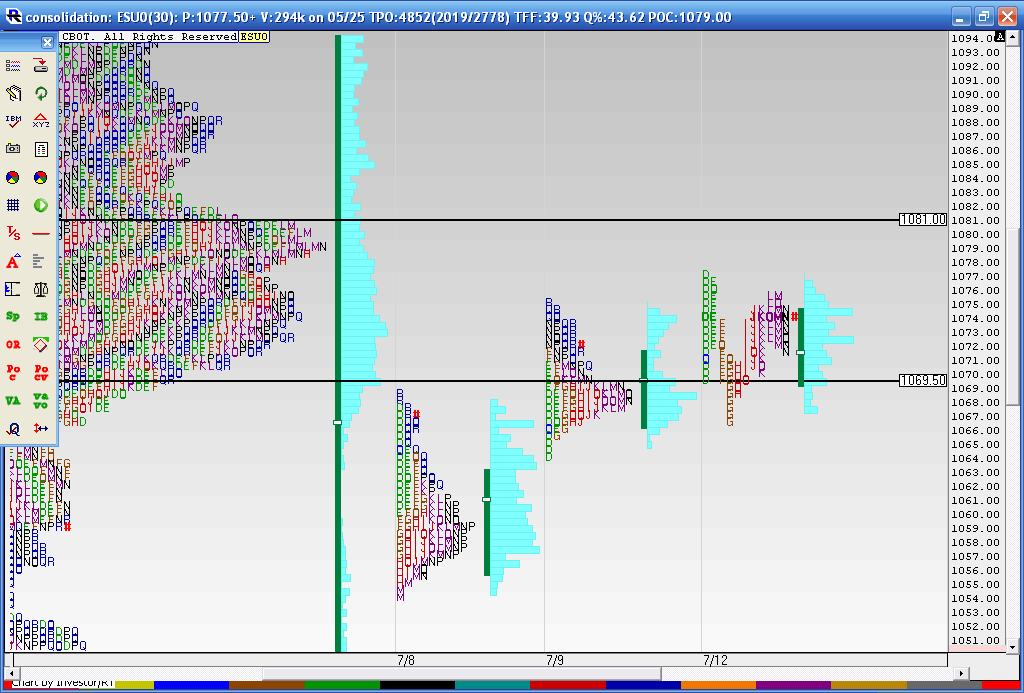
here's where we are...lower volume again and we are now at 1081 in the On session!!
Click image for original size
I'm watching to see if this consolidation has more POWER than the longer term view. If so then the next key area on the upside will really be 84 - 87 and the O/N session will not react ( selloff)from the 1081 area....so goes my quest to find out if anyone really watches the longer term profiles..
Originally posted by BruceM
here is the consolidation we need to be aware of for resistance now...we have 62.25 and the 73 - 75 area that started this drop in the O/N session..we also seem to have a volume spike in the 69 price..
Click image for original size
well today we gapped above that 81 area in RTH and never retested it. The next zone up which was 94 - 95 capped the upmove...all my trades from here forward will be heavily slanted to the short side until that 1078 - 1081 gets tested....my friends who are smarter than me are buying puts or so they say..here is the chart..In general I am a bit disappointed that these longer term profiles are not providing numbers that are any better than looking at daily reaction points from MP
On the upside we still have 1101 and the 1106 - 1109 zone....
On the upside we still have 1101 and the 1106 - 1109 zone....
Click image for original size
One more thing...if anyone has any ideas or resources that will help me make this thread more useful than please give your input either here or in private message...
Specifically I'm still trying to fiqure out if long term profiles are useful...
Specifically I'm still trying to fiqure out if long term profiles are useful...
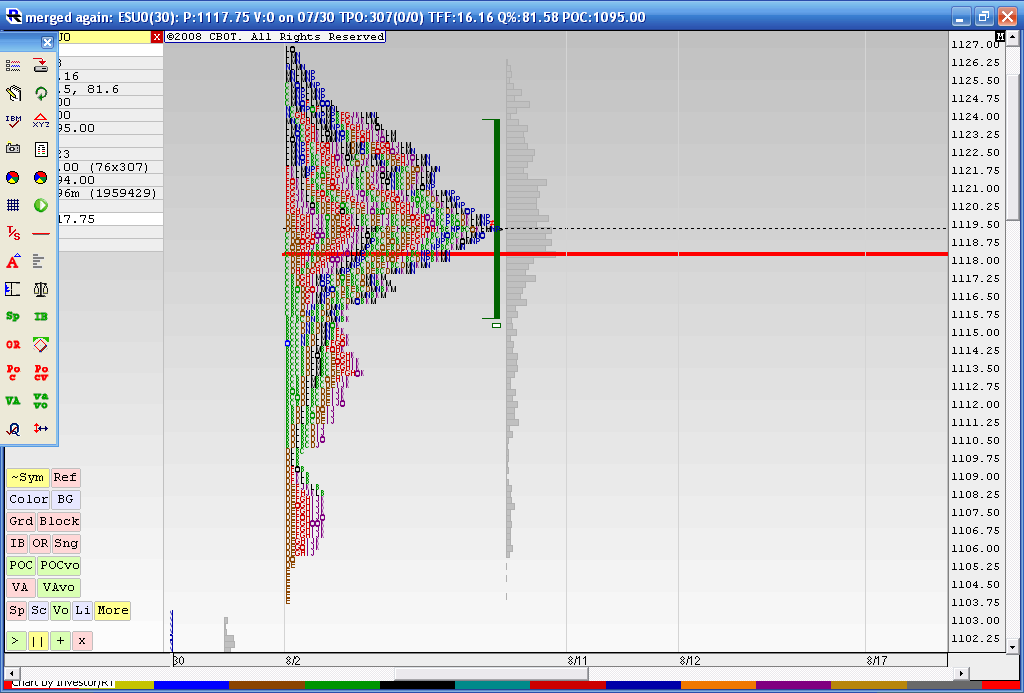
a look at what is trying to hold us back as we travel higher...this is the merged profile from 8-02 thru 8-10
Click image for original size
Emini Day Trading /
Daily Notes /
Forecast /
Economic Events /
Search /
Terms and Conditions /
Disclaimer /
Books /
Online Books /
Site Map /
Contact /
Privacy Policy /
Links /
About /
Day Trading Forum /
Investment Calculators /
Pivot Point Calculator /
Market Profile Generator /
Fibonacci Calculator /
Mailing List /
Advertise Here /
Articles /
Financial Terms /
Brokers /
Software /
Holidays /
Stock Split Calendar /
Mortgage Calculator /
Donate
Copyright © 2004-2023, MyPivots. All rights reserved.
Copyright © 2004-2023, MyPivots. All rights reserved.