Current MP Charts
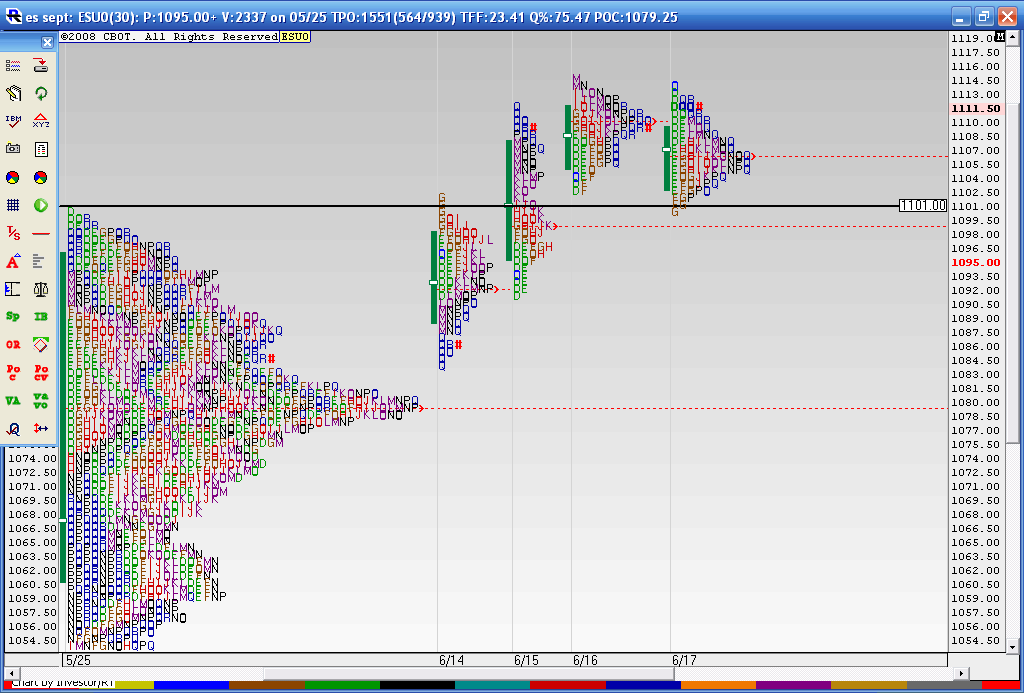
Here is a follow up to a chart I posted. I just don't remember where I posted it..Anyway this shows the Breakout on Monday 6-14 of the composite profile at 1101 and the fact that they held above the big composite node of 1079 - 1080 . Then we went up two more days on 6-15 and 6-16 and today was the first time we had lower price highs and lower Value ( solid green line to the left of the letters). The last three days all have overlapping Value. So we are coiled up and ready to trade for breakouts on Friday.
I also made note of the "bunching " together of the letters in my previous post thinking that a high was in. So I was wrong on that along with all the other cycle folks and market gurus. If this breakout starts to fail then we need to keep a close eye on the breakout point 1101 and of course that high volume node of 1079- 1180. The breakout point was tested today on Thursday and closed just off it's highs. These longer term profiles and my analysis is a work in progress so hopefully this journey will point out some good clues over time. Many are noticing the weakness in Volume and market internals since the breakout of 1101 so that needs to be factored in as we want to know "just how well" we are trending higher. So far I'd have to say not very well!!
I also made note of the "bunching " together of the letters in my previous post thinking that a high was in. So I was wrong on that along with all the other cycle folks and market gurus. If this breakout starts to fail then we need to keep a close eye on the breakout point 1101 and of course that high volume node of 1079- 1180. The breakout point was tested today on Thursday and closed just off it's highs. These longer term profiles and my analysis is a work in progress so hopefully this journey will point out some good clues over time. Many are noticing the weakness in Volume and market internals since the breakout of 1101 so that needs to be factored in as we want to know "just how well" we are trending higher. So far I'd have to say not very well!!
Click image for original size
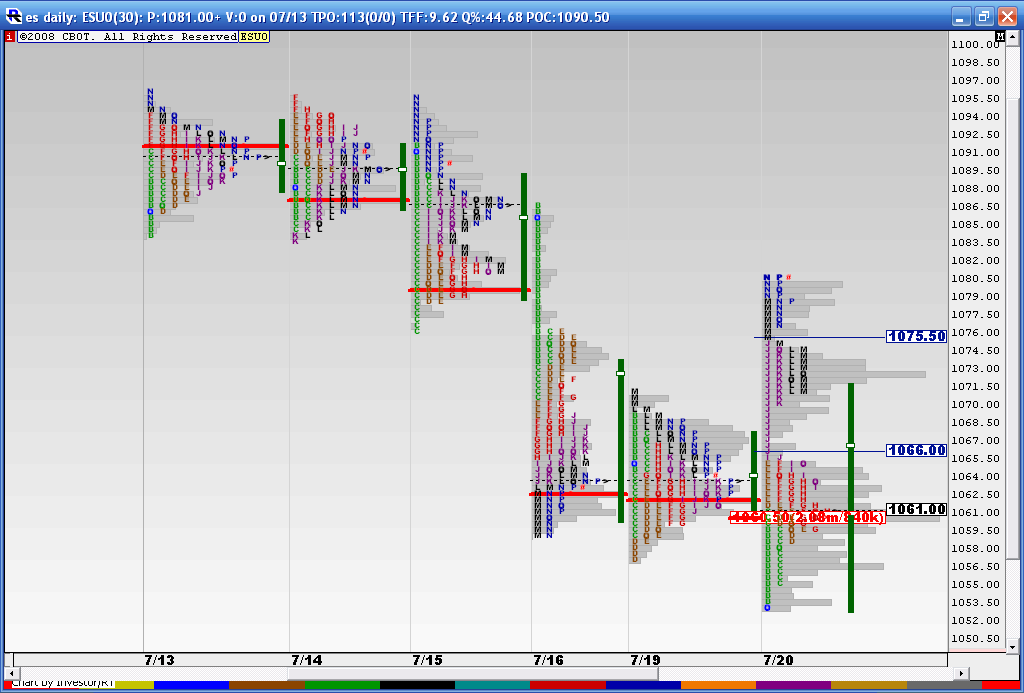
here is the last 6 days..
Click image for original size
here is a close up of the high volume area from last Tuesday- Wednesday...lots of volume bunched up there
Click image for original size
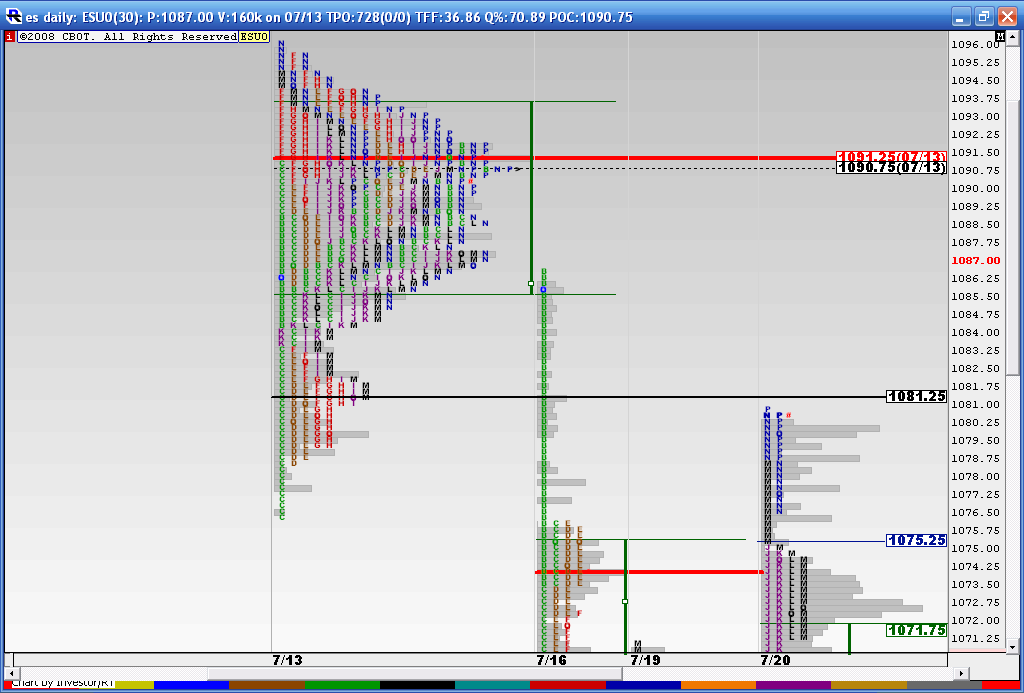
the software snapped that automatically...it is single prints , a giant air pocket if you look at the 30 minute bars....same thing with the 66 area...
Originally posted by Lorn
So what exactly does that 1075.50 number represent?
I'm still wrapping my head around MP concepts.
The second set ( the 75.50) usually get filled and don't usually stop sellers .it is the first set the 66 that shows where the smart breakout traders entered...but for me I am using 69 - 72.50 as my key zone due to all that volume and the Value area high..
Ok. I see what you are saying. So my next question is do you use this analysis only for RTH?
What about the current O/N session so far, does it fit into this bigger picture or not?
What about the current O/N session so far, does it fit into this bigger picture or not?
Originally posted by BruceM
The second set ( the 75.50) usually get filled and don't usually stop sellers .it is the first set the 66 that shows where the smart breakout traders entered...but for me I am using 69 - 72.50 as my key zone due to all that volume and the Value area high..
I will use in for O/N but it must be a good setup as I don't really like the O/N trading scene. Most times the O/N will help confirm an area...Like this morning in the O/N when volume built on the histogram at 55 and I had 55 as a number from the 60 minute poc's. Or currently I have 85-86 as a key and 90.50 - 93... so far in O/N it's confirming the 85 area....just as an example..
Originally posted by BruceM
the software snapped that automatically...it is single prints , a giant air pocket if you look at the 30 minute bars....same thing with the 66 area...Originally posted by Lorn
So what exactly does that 1075.50 number represent?
I'm still wrapping my head around MP concepts.
The MP terminology for "air pockets" are Low Volume Nodes (LVN's).
LVN's are significant because there was very little business done in that area, implying "not fair" value. So, this means either breakout (vortex thru action), or bounce rejection.
Click image for original size
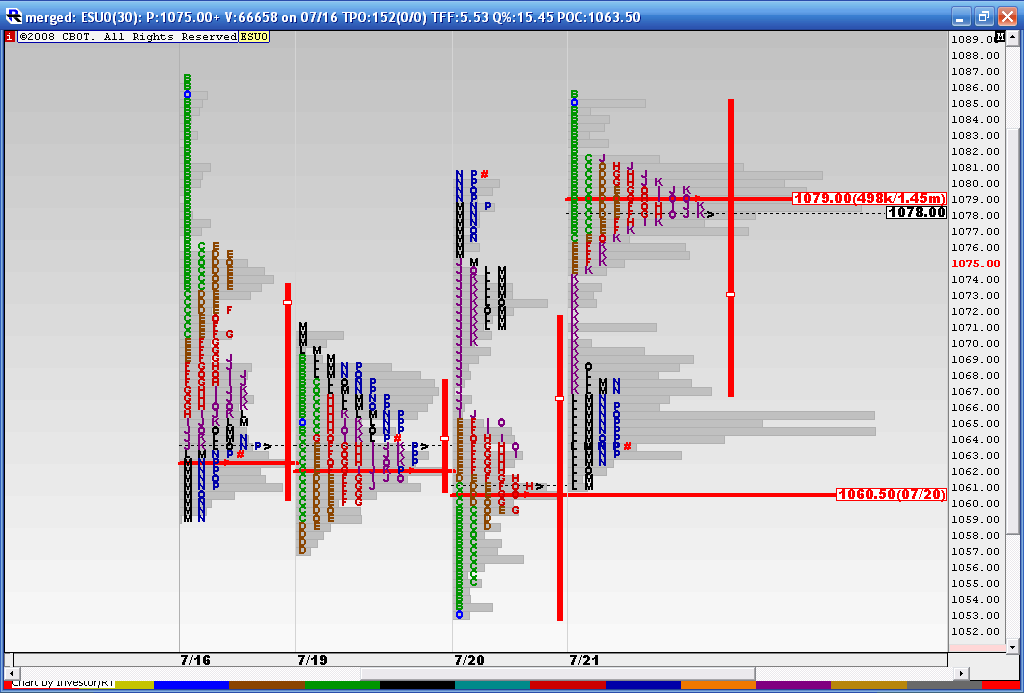
If you look at the composite profile that Bruce attached, you'll notice an LVN at around the 1084-85 area. That just so happens to be tonight's GLOBEX session highs.
I think what confuses people is the fact that we use the words "low volume" and "high volume" sometimes. The air pockets and single prints are places where little TIME has been spent as the market has pushed through ( broke out from) an area so there has not been much buying and selling ( two sided trade). One side has overtaken the other and it usually takes Vertical volume to do this.
So when we have "Buying single prints", the buyers have overtaken the sellers and the market goes higher quickly. So while we may have big volume on our lower volume indicator , the histogram will show little Time spent at those prices.
This chart can probably show it better than I can explain it..
So when we have "Buying single prints", the buyers have overtaken the sellers and the market goes higher quickly. So while we may have big volume on our lower volume indicator , the histogram will show little Time spent at those prices.
This chart can probably show it better than I can explain it..
Click image for original size

here is the last 4 days
Click image for original size
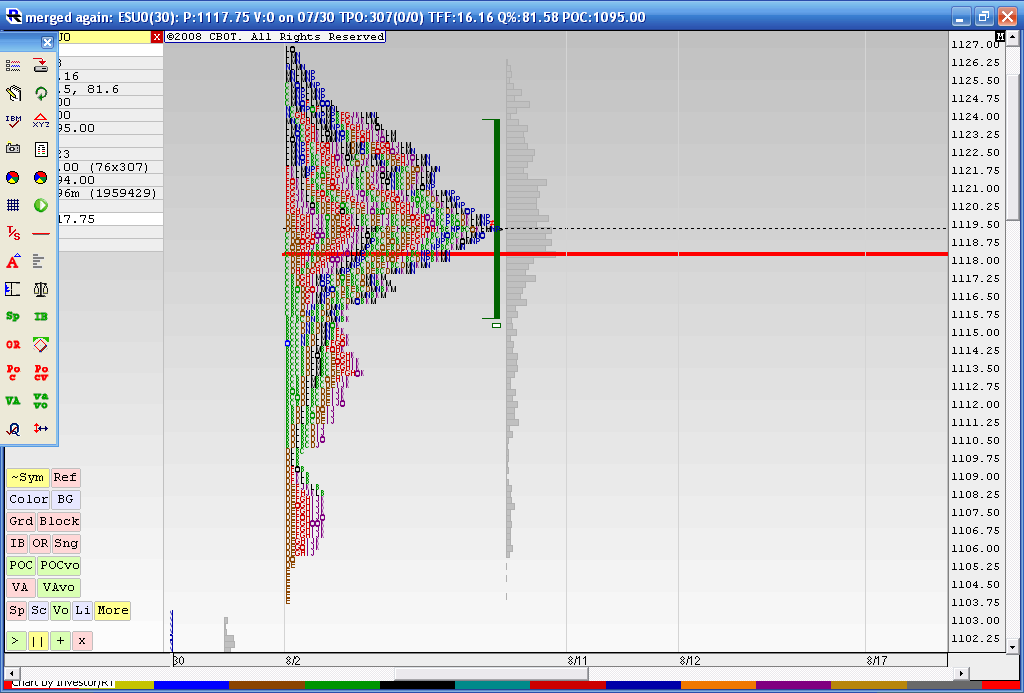
a look at what is trying to hold us back as we travel higher...this is the merged profile from 8-02 thru 8-10
Click image for original size
Emini Day Trading /
Daily Notes /
Forecast /
Economic Events /
Search /
Terms and Conditions /
Disclaimer /
Books /
Online Books /
Site Map /
Contact /
Privacy Policy /
Links /
About /
Day Trading Forum /
Investment Calculators /
Pivot Point Calculator /
Market Profile Generator /
Fibonacci Calculator /
Mailing List /
Advertise Here /
Articles /
Financial Terms /
Brokers /
Software /
Holidays /
Stock Split Calendar /
Mortgage Calculator /
Donate
Copyright © 2004-2023, MyPivots. All rights reserved.
Copyright © 2004-2023, MyPivots. All rights reserved.