Current MP Charts
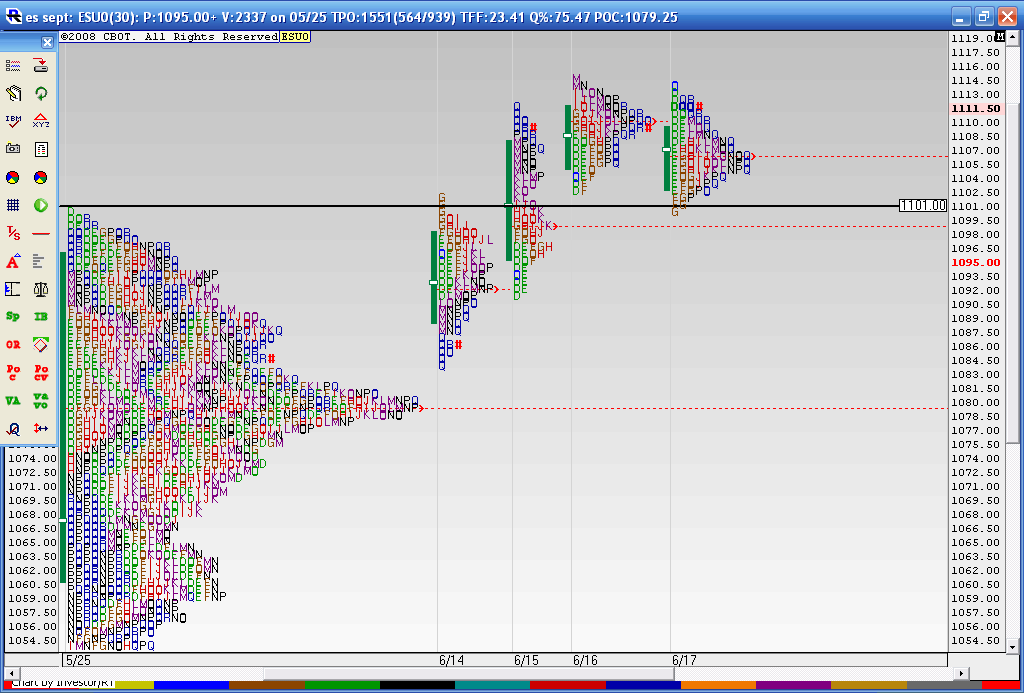
Here is a follow up to a chart I posted. I just don't remember where I posted it..Anyway this shows the Breakout on Monday 6-14 of the composite profile at 1101 and the fact that they held above the big composite node of 1079 - 1080 . Then we went up two more days on 6-15 and 6-16 and today was the first time we had lower price highs and lower Value ( solid green line to the left of the letters). The last three days all have overlapping Value. So we are coiled up and ready to trade for breakouts on Friday.
I also made note of the "bunching " together of the letters in my previous post thinking that a high was in. So I was wrong on that along with all the other cycle folks and market gurus. If this breakout starts to fail then we need to keep a close eye on the breakout point 1101 and of course that high volume node of 1079- 1180. The breakout point was tested today on Thursday and closed just off it's highs. These longer term profiles and my analysis is a work in progress so hopefully this journey will point out some good clues over time. Many are noticing the weakness in Volume and market internals since the breakout of 1101 so that needs to be factored in as we want to know "just how well" we are trending higher. So far I'd have to say not very well!!
I also made note of the "bunching " together of the letters in my previous post thinking that a high was in. So I was wrong on that along with all the other cycle folks and market gurus. If this breakout starts to fail then we need to keep a close eye on the breakout point 1101 and of course that high volume node of 1079- 1180. The breakout point was tested today on Thursday and closed just off it's highs. These longer term profiles and my analysis is a work in progress so hopefully this journey will point out some good clues over time. Many are noticing the weakness in Volume and market internals since the breakout of 1101 so that needs to be factored in as we want to know "just how well" we are trending higher. So far I'd have to say not very well!!
Click image for original size
Bruce,
thanks for the charts,
what is vertical red line?
thanks for the charts,
what is vertical red line?
that's is the value area ...I need to make those more friendly
I don't think you have to do anything to the look of the chart now that I know what the vertical is.
today, trade day 7-29-10, price moved up and took out the VAH before reversing. Is that something to have been expected in an interpretation of the composite chart you posted? I'm asking... I don't know.
The volume at price histogram/mp style of displaying PA approach seems much more realistic than straight MP. Am I just supposed to apply standard MP interpretations to the volume at price data?
About 2 years ago I read most of "Mind over Markets" MP book, but I never used it, Maybe I have to go back and re-read with the idea of "Volume at Price" instead of straight MP.
I am not trying to hijack this thread, I am only expressing observations (that seem to have been constantly evolving over the 21 years I have worked in the markets and traded them), but one of the reasons I stopped actually looking at standard MP (which I charted by hand for almost a year) is because I thought the MP (straight MP, not Volume at Price style histogram) was simply displaying chart Prices in a different orientation.
To illustrate what I am talking about: today, I do pay attention to mostly RTH because that is where the Big Money is swinging size (or not).
Today price printed 1113.00 and reversed.
This week, on RTH Tuesday, price moved up to form 3 rejections near 1113,
at 12:20pm print 1112.75,
at 2:20pm print 1112.75,
at 3:35pm print 1113.00 (a 1 tick "take-out" like I explained yesterday in daily thread.
I guess the volume at price would not have built a ledge there unless PA was what it was.
Now, today, price gapped higher at the open, eclipsed that VAH you had on the combined chart; print H this morning was 1113.00, exactly, "to the tick," of the one tick "takeout" from Tuesday (I mentioned yesterday, that I have been studying PA after DB or DT relative to whether price has equaled, failed to reach, or displayed a one tick take-out of previous bottom or top price) favorite is 1 tick past, but print = previous swing L/H is also valid.)
I don't know, maybe I'm only illustrating the idea that there are more than two ways to skin a cat.
I have to turn off the computers, I'm supposed to be taking a break this week and another week sometime in August.
Great observations Paul. I like your questions regarding the Volume profile approach. Perhaps its easier to conceptualize then a time based approach. Just a thought.
failed auction above the Highs of the Mon-wednesday composite leads to a down OVB on the dailies....here is today against some of the areas as well as the reason I had the 89 - 91 on my radar....
Paul, the short response because it's late is that I'm migrating to Volume profiles and that is what is on my charts....
Paul, the short response because it's late is that I'm migrating to Volume profiles and that is what is on my charts....
Click image for original size

here are the daily profiles for a few days up to thursday
Click image for original size

Paul,
I never really know what to expect in the S&P but that failed auction higher seemed "almost obvious" after the first 15 minutes as it was higher then Wednesdays vertical volume but price closed on the lows. LOok at a 15 minute bar chart with volume for that. I was also looking at the volume when the 8:30 report hit and was surprised how low the volume was on that report.
I like the results so far of using the Volume profiles over standard MP...it makes sense. The peak volume price or POC seems logical..Often the two methods of VA calculations will line up closely. Perhaps that is why the shape of the profiles seems more important then the actual VA highs or lows. Combining the days that overlap is tricky for me so far but I'm getting closer to finding usable numbers and figuring out what is relevant. And yes I think standard MP concepts can be applied to Volume profiles because we are dealing with structures and they will EVENTUALLY be more accurate as more use the actual volume traded.
It's frustrating at times because there are so many freakin ways to trade, there ALWAYS seems to be a number from another method lurking around MY numbers...LOL...how do we ever really know ? So perhaps u r right and it is just another way of looking at the charts but I think the volume adds a better dimension.
Daltons book is quite good even if one is to never use MP. So in your spare time you may want to read it again using your volume profiles and see if it makes anything clearer. I probably look through it once a week and sometimes new things jump out at me...
Perhaps we should start a thread and really hammer away at volume profiles just for the day time frame and really hash things out....this thread was always meant to study combined profiles but it's all good and I don't care where it evolves to...so don't worry about thread jacking...those are all valid concerns and questions..
Originally posted by PAUL9
today, trade day 7-29-10, price moved up and took out the VAH before reversing. Is that something to have been expected in an interpretation of the composite chart you posted? I'm asking... I don't know.
The volume at price histogram/mp style of displaying PA approach seems much more realistic than straight MP. Am I just supposed to apply standard MP interpretations to the volume at price data?
About 2 years ago I read most of "Mind over Markets" MP book, but I never used it, Maybe I have to go back and re-read with the idea of "Volume at Price" instead of straight MP.
I am not trying to hijack this thread, I am only expressing observations (that seem to have been constantly evolving over the 21 years I have worked in the markets and traded them), but one of the reasons I stopped actually looking at standard MP (which I charted by hand for almost a year) is because I thought the MP (straight MP, not Volume at Price style histogram) was simply displaying chart Prices in a different orientation.
To illustrate what I am talking about: today, I do pay attention to mostly RTH because that is where the Big Money is swinging size (or not).
Today price printed 1113.00 and reversed.
This week, on RTH Tuesday, price moved up to form 3 rejections near 1113,
at 12:20pm print 1112.75,
at 2:20pm print 1112.75,
at 3:35pm print 1113.00 (a 1 tick "take-out" like I explained yesterday in daily thread.
I guess the volume at price would not have built a ledge there unless PA was what it was.
Now, today, price gapped higher at the open, eclipsed that VAH you had on the combined chart; print H this morning was 1113.00, exactly, "to the tick," of the one tick "takeout" from Tuesday (I mentioned yesterday, that I have been studying PA after DB or DT relative to whether price has equaled, failed to reach, or displayed a one tick take-out of previous bottom or top price) favorite is 1 tick past, but print = previous swing L/H is also valid.)
I don't know, maybe I'm only illustrating the idea that there are more than two ways to skin a cat.
I have to turn off the computers, I'm supposed to be taking a break this week and another week sometime in August.
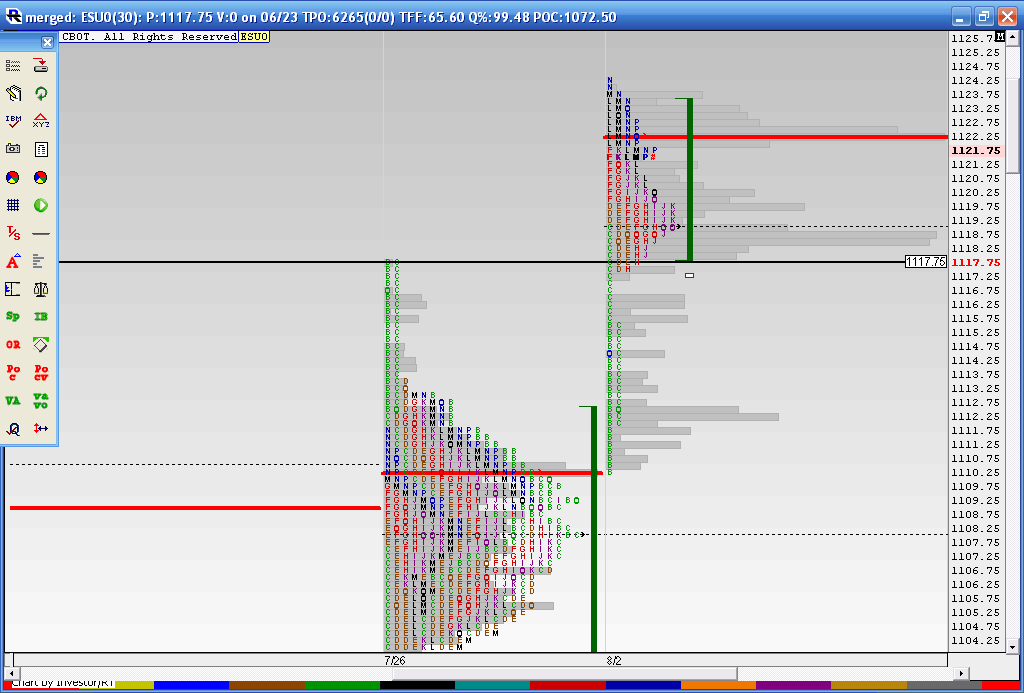
I couldn't fit it all but here is the upper part of the merge of all of last weeks trading with todays profile. I had 1108 - 1110 as a key area this morning based on the POC of last week and some of the daily work. It sure didn't help me buy the market but the real interesting thing was we formed the "P" profile for a good part of the day ABOVE last weeks high of 1117.75. That helped me avoid holding shorts into new highs. So some things are promising.
Click image for original size
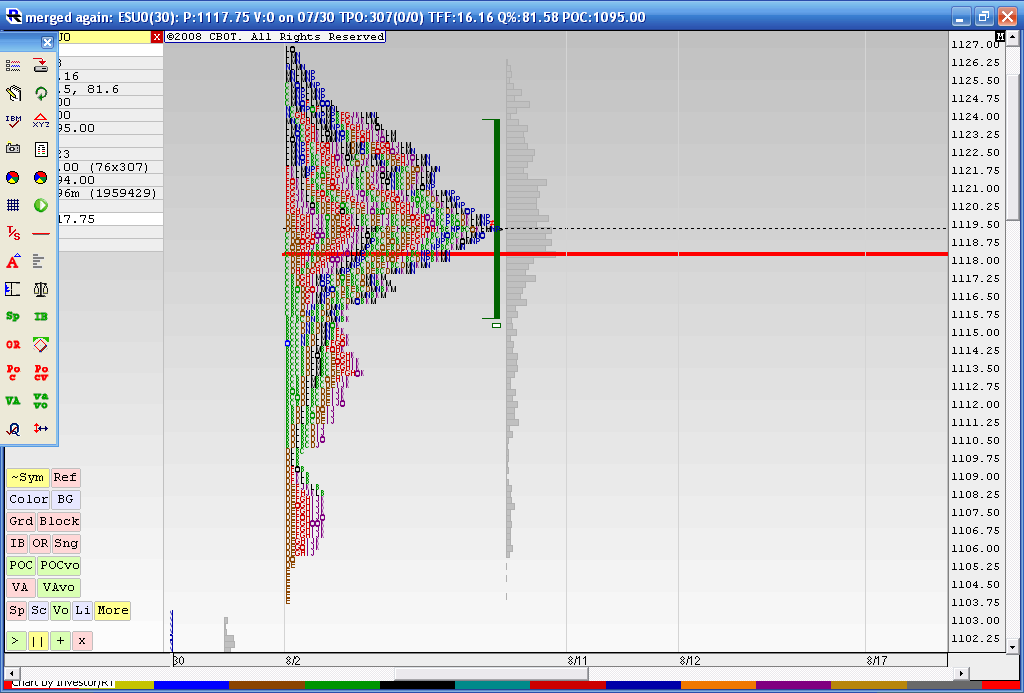
a look at what is trying to hold us back as we travel higher...this is the merged profile from 8-02 thru 8-10
Click image for original size
Emini Day Trading /
Daily Notes /
Forecast /
Economic Events /
Search /
Terms and Conditions /
Disclaimer /
Books /
Online Books /
Site Map /
Contact /
Privacy Policy /
Links /
About /
Day Trading Forum /
Investment Calculators /
Pivot Point Calculator /
Market Profile Generator /
Fibonacci Calculator /
Mailing List /
Advertise Here /
Articles /
Financial Terms /
Brokers /
Software /
Holidays /
Stock Split Calendar /
Mortgage Calculator /
Donate
Copyright © 2004-2023, MyPivots. All rights reserved.
Copyright © 2004-2023, MyPivots. All rights reserved.