Current MP Charts
Here is a follow up to a chart I posted. I just don't remember where I posted it..Anyway this shows the Breakout on Monday 6-14 of the composite profile at 1101 and the fact that they held above the big composite node of 1079 - 1080 . Then we went up two more days on 6-15 and 6-16 and today was the first time we had lower price highs and lower Value ( solid green line to the left of the letters). The last three days all have overlapping Value. So we are coiled up and ready to trade for breakouts on Friday.
I also made note of the "bunching " together of the letters in my previous post thinking that a high was in. So I was wrong on that along with all the other cycle folks and market gurus. If this breakout starts to fail then we need to keep a close eye on the breakout point 1101 and of course that high volume node of 1079- 1180. The breakout point was tested today on Thursday and closed just off it's highs. These longer term profiles and my analysis is a work in progress so hopefully this journey will point out some good clues over time. Many are noticing the weakness in Volume and market internals since the breakout of 1101 so that needs to be factored in as we want to know "just how well" we are trending higher. So far I'd have to say not very well!!
I also made note of the "bunching " together of the letters in my previous post thinking that a high was in. So I was wrong on that along with all the other cycle folks and market gurus. If this breakout starts to fail then we need to keep a close eye on the breakout point 1101 and of course that high volume node of 1079- 1180. The breakout point was tested today on Thursday and closed just off it's highs. These longer term profiles and my analysis is a work in progress so hopefully this journey will point out some good clues over time. Many are noticing the weakness in Volume and market internals since the breakout of 1101 so that needs to be factored in as we want to know "just how well" we are trending higher. So far I'd have to say not very well!!
Click image for original size
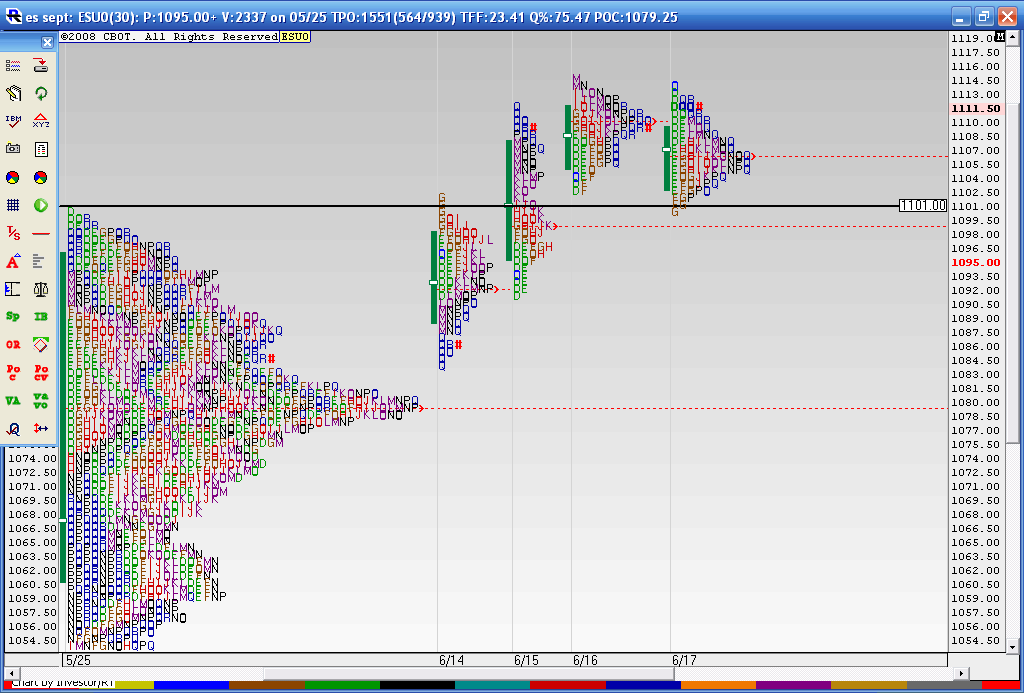
chart directly above this comment is good, but Bruce, on my crude volume profile charts (produced by TradeStation), if I have just daily bar with a volume at price histogram on the daily bars only,
June 22, 2010 on my chart had a virgin volume POC at 1108.00 to 1108.25. (Trade Station has rudimentary volume at price)
I was wondering if you could produce a volume at Price histo for the day of June 22, 2010. I am curious to see if a more accurate plotting would have identified 1109.50- 1109.75 area.
Back on 7-6-10 I was burned and stopped at a loss on a long. As I have reviewed these daily histos of volume at price I noticed that on that particular day, price reached up and tested a virgin volume POC created on 6-30-10 before violent price reversal. for that 6-30 day I had 1039.00 and 1039.50 HVN (2 spikes in histo that looked Identical to me) and on the Test of that HVN, High print was 1038.50 before price reversal.
Here is how we look today bumping into that 1109 number....we created the "P" profile from just today s trading and if we were near an OBVIOUS resistance area I wouldn't be concerned but we have the formation happening in the MIDDLE of a consolidation range so I'm thinking that any gap higher tomorrow will be a sell or a first rally up from a lower open. We also have the second time in 4 trading days that the $ticks have closed above 1000 so this may be a great short area. Ok, I'll keep this thread to MP..here is the chart..
Click image for original size
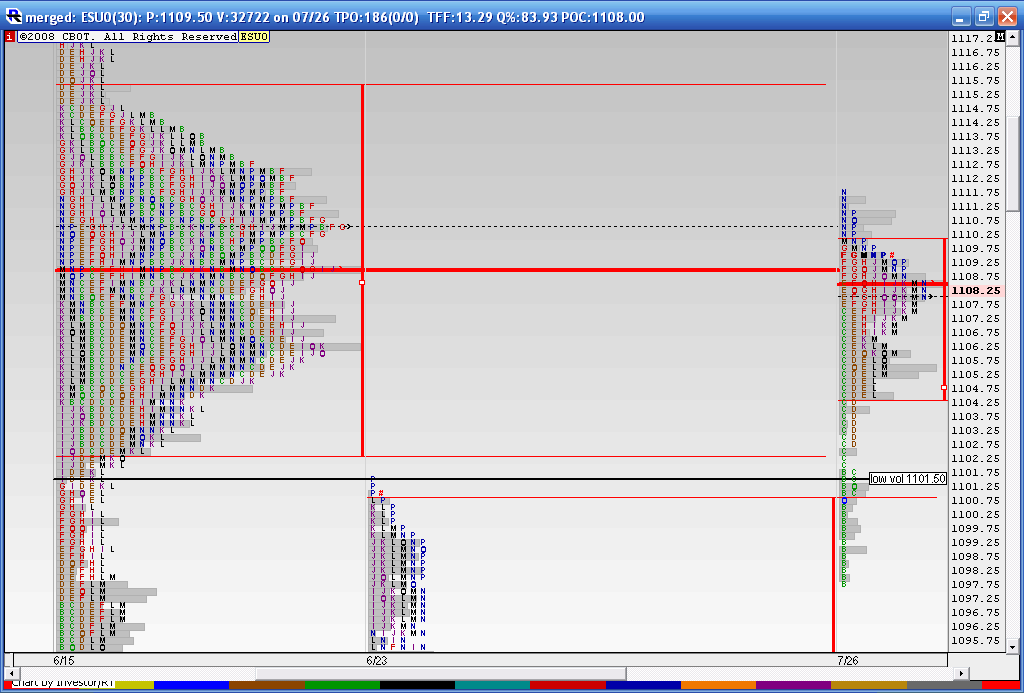
Paul, here is the chart you wanted...the problem with using volume POc's is that many times you see a huge volume spike at the 4 PM cash close so that will mess up the automatic RED line from Investor r/t. So on my chart the volume POC is 1092 but I would have been looking at the gray histogram and seeing Volume at 1107.50. If you look at the black dashed line that is the time POC up at 1108.50 based on Time alone.
Hope this helps
Hope this helps
Click image for original size

Bruce,
Does this include O/N data? My profile from today doesn't have the P formation you are talking about.
Does this include O/N data? My profile from today doesn't have the P formation you are talking about.
Originally posted by BruceM
Here is how we look today bumping into that 1109 number....we created the "P" profile from just today s trading and if we were near an OBVIOUS resistance area I wouldn't be concerned but we have the formation happening in the MIDDLE of a consolidation range so I'm thinking that any gap higher tomorrow will be a sell or a first rally up from a lower open. We also have the second time in 4 trading days that the $ticks have closed above 1000 so this may be a great short area. Ok, I'll keep this thread to MP..here is the chart..
Click image for original size
No it doesn't Lorn, just the RTH...then I look at O/N session to confirm the areas
Thanks Bruce.
Here is Monday and Tuesday up against the merged composite..I have extended the value area lines over for clarity. Today we had two attempts to get outside the composites VA high of 1115.50 and both attempts have failed. I am looking at this like any other value area. Trade outside of Value that gets back into Value SHOULD be telling us something. We certainly don't want to see trade above Value again as that may imply a break away from value.
While Monday gave us the "P" profile , today gave us the "b"...so in the next post I will merge monday and tuesday.
While Monday gave us the "P" profile , today gave us the "b"...so in the next post I will merge monday and tuesday.
Click image for original size
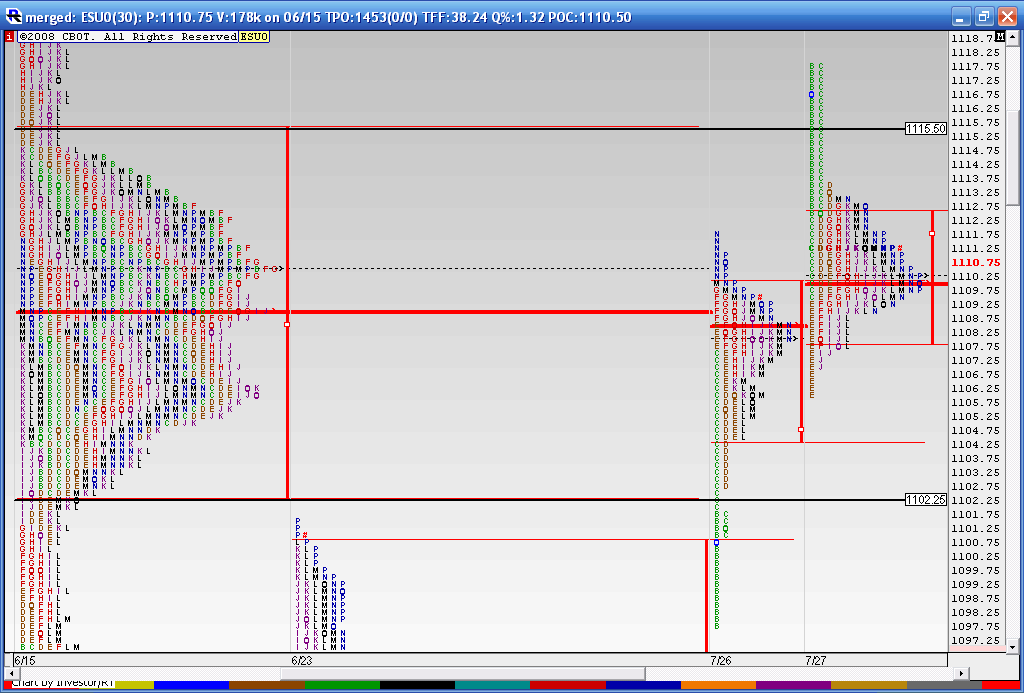
here is what it looks like when I merge Monday and Tuesday...we get a VA of 1112.75 and 1005.75 and the huge volume at 1109 - 1110. We need to be careful as we should break away from this value and form new value higher or lower tomorrow...the point is we hopefully can monitor these 3 key price levels and volume for a clue to point direction as this is a mature profile so we should move away from it
Click image for original size

here is how wednesday played out against the composite and the merged profile of Monday and Tuesday..I think the key areas going forward on the upside will be 1105.50 - 1106.75 and the 1109 - 1110 area
next post will merge all three trading days this week as we have overlapping value
next post will merge all three trading days this week as we have overlapping value
Click image for original size
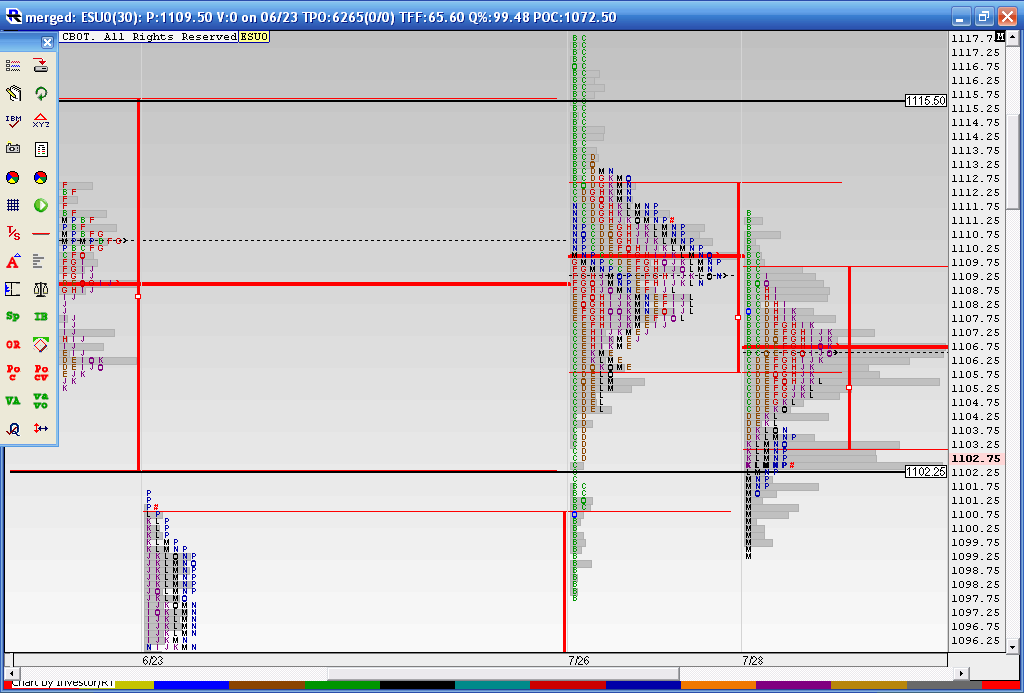
Merging all days this week really makes the 1108 - 1110 area jump out so that will be the dividing line with reports in the morning. If you look closely we closed today ( the red # sign) at the 1102 area and that was the VA low of our bigger composite..
My bias will be to the downside as we have the range of Monday and Tuesday which has yet to be violated and also the weekly pivot hasn't been traded to yet ( down at 1084)....we also closed below the big 1108 - 1110 volume node. Key support will be 1089 - 1091.
My bias will be to the downside as we have the range of Monday and Tuesday which has yet to be violated and also the weekly pivot hasn't been traded to yet ( down at 1084)....we also closed below the big 1108 - 1110 volume node. Key support will be 1089 - 1091.
Click image for original size

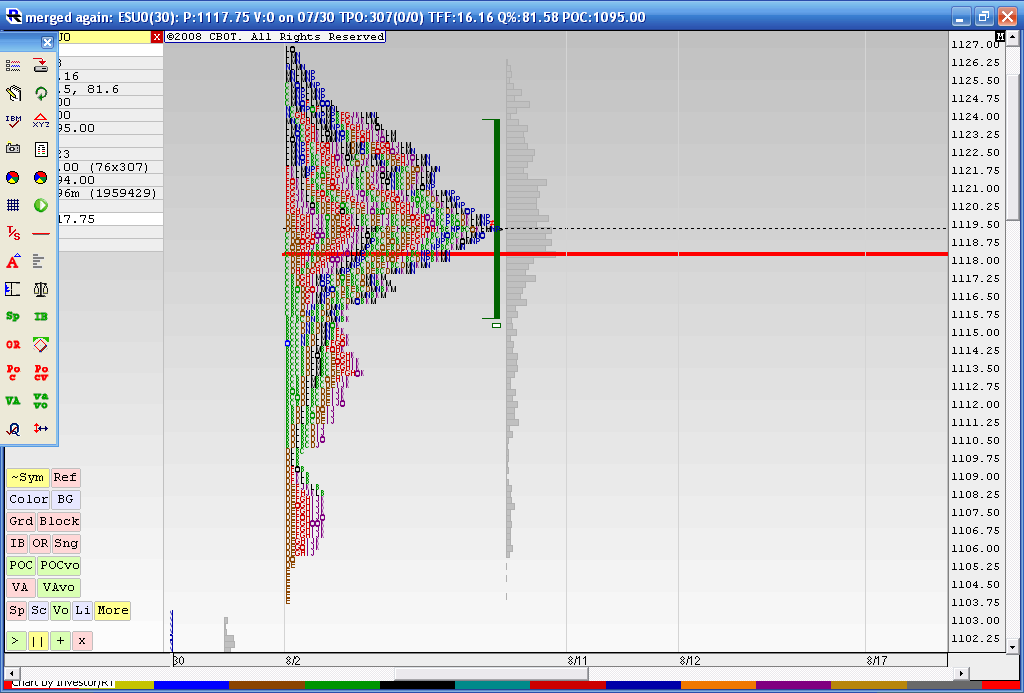
a look at what is trying to hold us back as we travel higher...this is the merged profile from 8-02 thru 8-10
Click image for original size
Emini Day Trading /
Daily Notes /
Forecast /
Economic Events /
Search /
Terms and Conditions /
Disclaimer /
Books /
Online Books /
Site Map /
Contact /
Privacy Policy /
Links /
About /
Day Trading Forum /
Investment Calculators /
Pivot Point Calculator /
Market Profile Generator /
Fibonacci Calculator /
Mailing List /
Advertise Here /
Articles /
Financial Terms /
Brokers /
Software /
Holidays /
Stock Split Calendar /
Mortgage Calculator /
Donate
Copyright © 2004-2023, MyPivots. All rights reserved.
Copyright © 2004-2023, MyPivots. All rights reserved.