MyPivots
Sign In
JA
jarek
Rep: 94
Posts: 3,474
Here is an interesting story. While writing the topic above I was thinking about what chart to show this weekend. Then I noticed that the second date is a palindrome or in some way it is 'symmetrical'. Then I recalled Jim saying that sometimes ABCDs like to be symmetrical around certain point. Then I started digging and ended up with the following chart:


Click image for original size
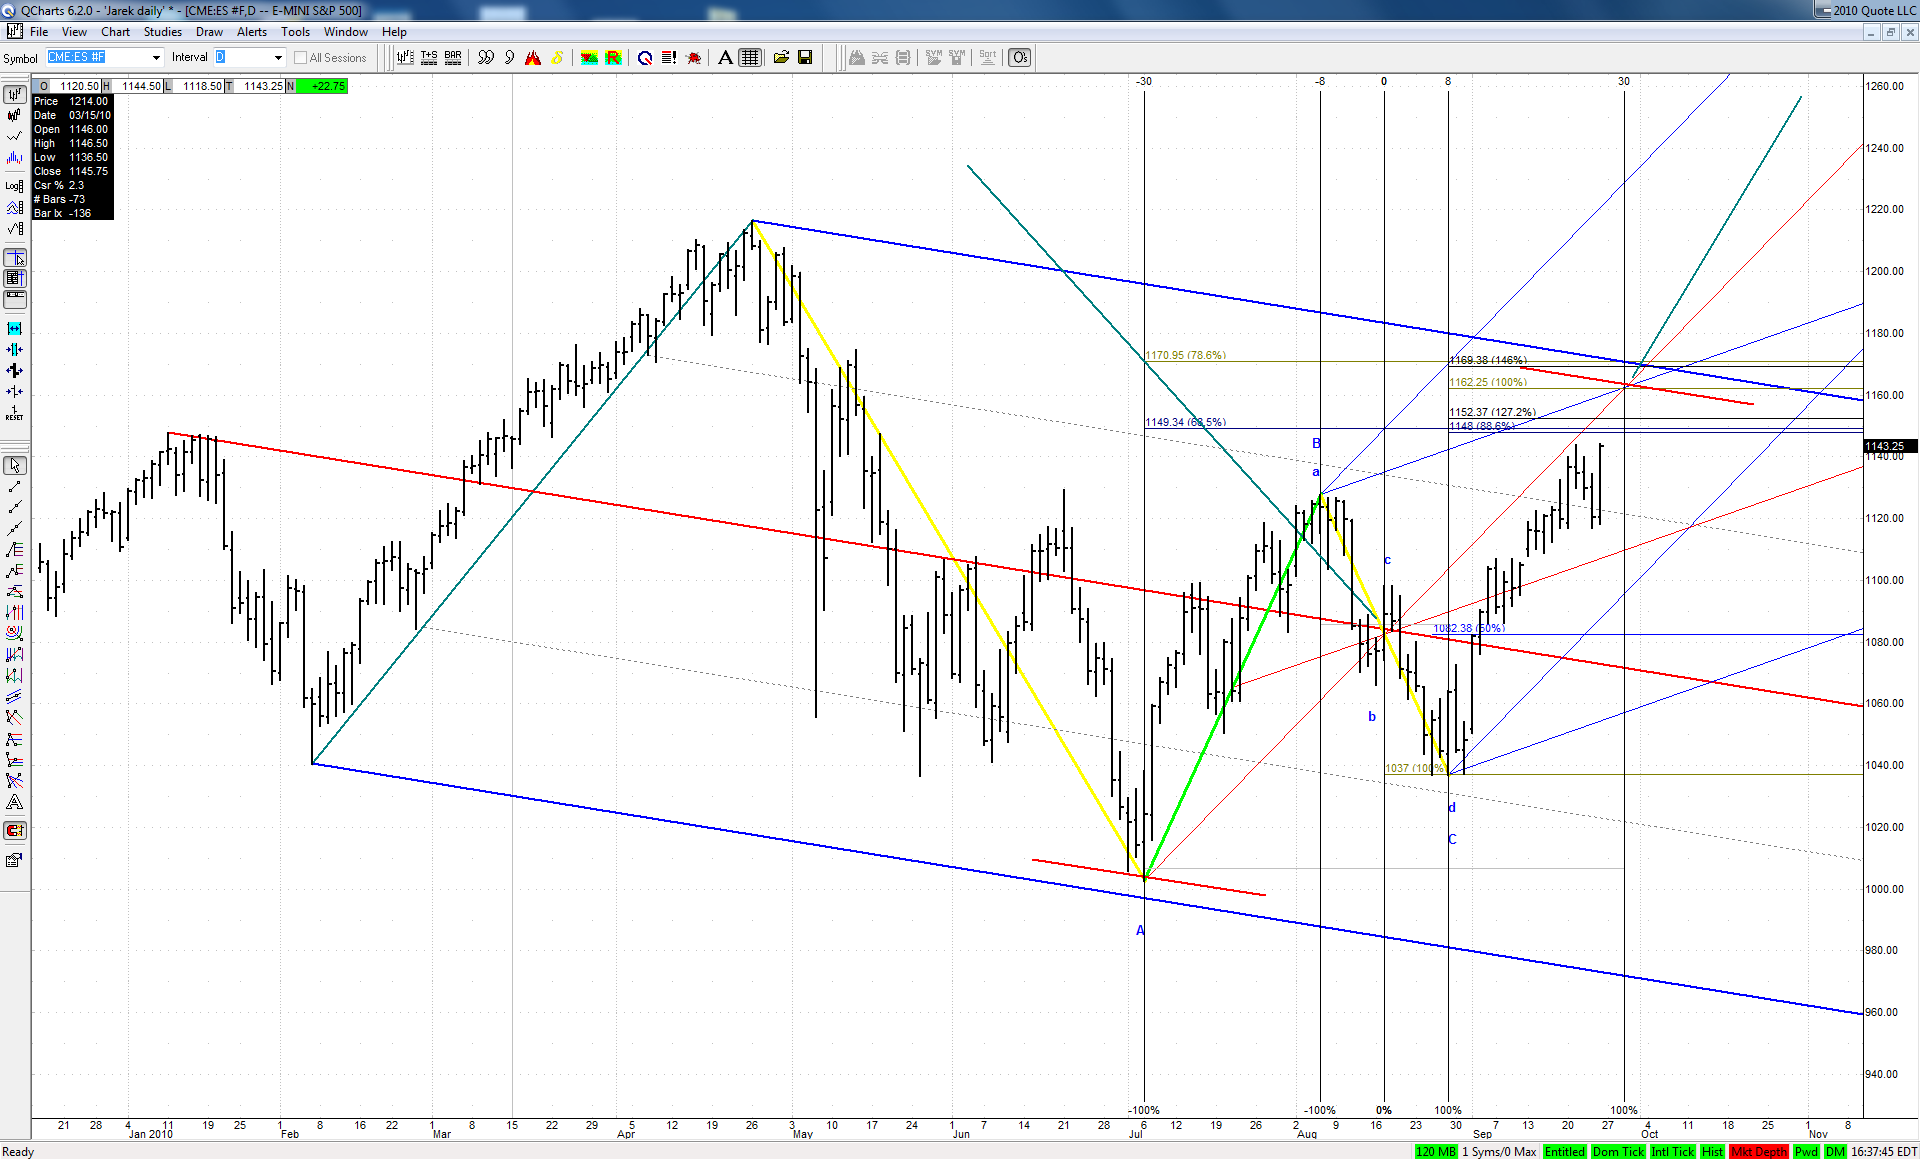


We may see that the BC leg of our current bearish ABCD, which was an ABCD itself was perfectly centered both in price and in time around its 'hub of the wheel' point on August 17th at around 1082 level.
To share the same characteristic the big ABCD should end on September 29th at around 1162 level. What's more interesting - this point is pretty well justified geometrically. Very curious.
JI
jimkane
Rep: 3,058
Posts: 33,089
I was going to comment last night but then time got away from me. I voted this one up, and I see today it has one vote. I understand that until someone has 100 points they can't vote (I may ask Guy if he can give 100 points to the entire membership in here so they can vote, which he did when he started the system, he gave 100 points to many known posters to get it started), but of the fifteen reads so far, no established posters read this or found it worth voting on???

If I could I'd vote this up ten points myself, or more. This chart basically duplicates my 'W2' scenario chart (except the time symmetry, more on that shortly), which I have had, and have mentioned, for awhile. This is one of the technically 'tightest' 'W2' setups I've ever seen. It also has potentially profound effect literally for the entire world. This 'W2' may never manifest, but if it doesn't, that tells us all something big time.

Add on the absolutely beautiful time symmetry, which I hadn't paid enough attention to notice, and you have a most gorgeous setup. This chart and comments deserve ten up votes from everyone in here, in my opinion. This is what we should all be watching. The only thing I don't like about this setup is that it may fall into that category of 'too perfect', a real '10', and many times those fail.

All I can say is this is a place where, if triggered, I will be looking at puts myself, and if it blows out, that's fine. I don't have to close existing calls on a small trigger. I can 'straddle' it until I see what happens, if I want.

Two thumbs up on the post, jarek.
JI
jimkane
Rep: 3,058
Posts: 33,089
How bizarre was that??? In keeping with my 'philosophy' of buying the Sunday night open, the futures open and start to make their ascent upward. So far, so good, for the Sunday night cash machine, that seems to work almost every single Sunday night, as mentioned in here many, many times. It's been an ATM for over a year now.

Anyway, all of the sudden it jumps over 5 points in a heartbeat. There was like 7K volume, which is nothing, but apparently there was no depth at all to handle that little bit??? So, it was up 6.25 at the high, in a blink, with lots of time for an opening fill, in my opinion, at up a point or so. How's that for a start?

Now, maybe that's it. But, more likely I think, it just keeps doing the same nonsense it has been doing. That would really be something, though, after a move well over 20 points in one day. No need for even a checkback, and it's going to gap open up 10 or more??? Wow.

So, for now, just going to watch the Sunday night ATM play and see what it gives. Will I ever sleep again? Probably not until after the entire system collapses and trading ends. There will be plenty of time to sleep after that...
JI
jimkane
Rep: 3,058
Posts: 33,089
Small ABCD correction done, next leg up starting??? Was that an add-on spot?
JI
jimkane
Rep: 3,058
Posts: 33,089
Very curious, that they brought it in more than the small ABCD. I'm watching in here at around 44 (possibly down to 43), at the key line here, to see if they come back in at that point. I'd love to see it sell off more, but I'm not counting on it.
JI
jimkane
Rep: 3,058
Posts: 33,089
Low was 43.75, then up 2.25. Let's see if they have any sustain to it.
JA
jarek
Rep: 94
Posts: 3,474
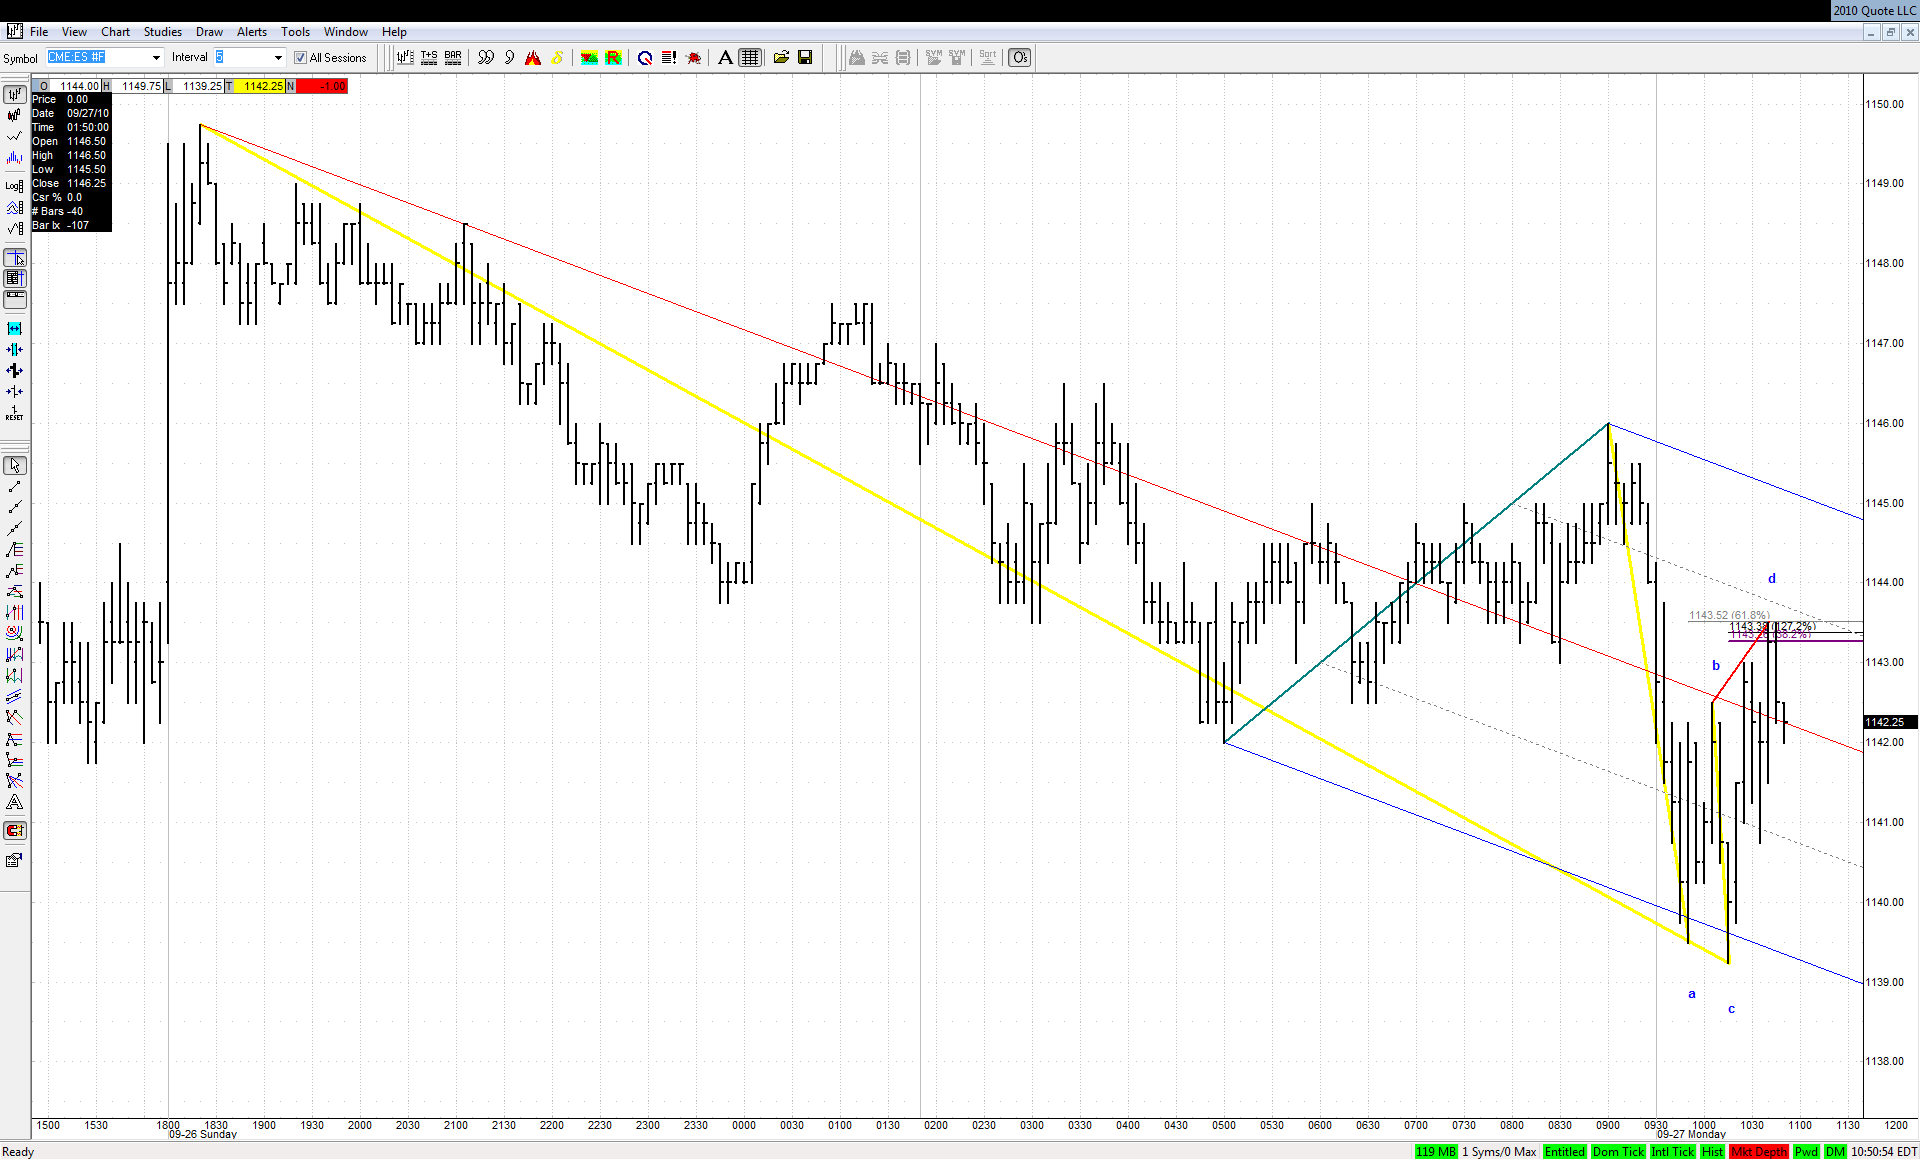
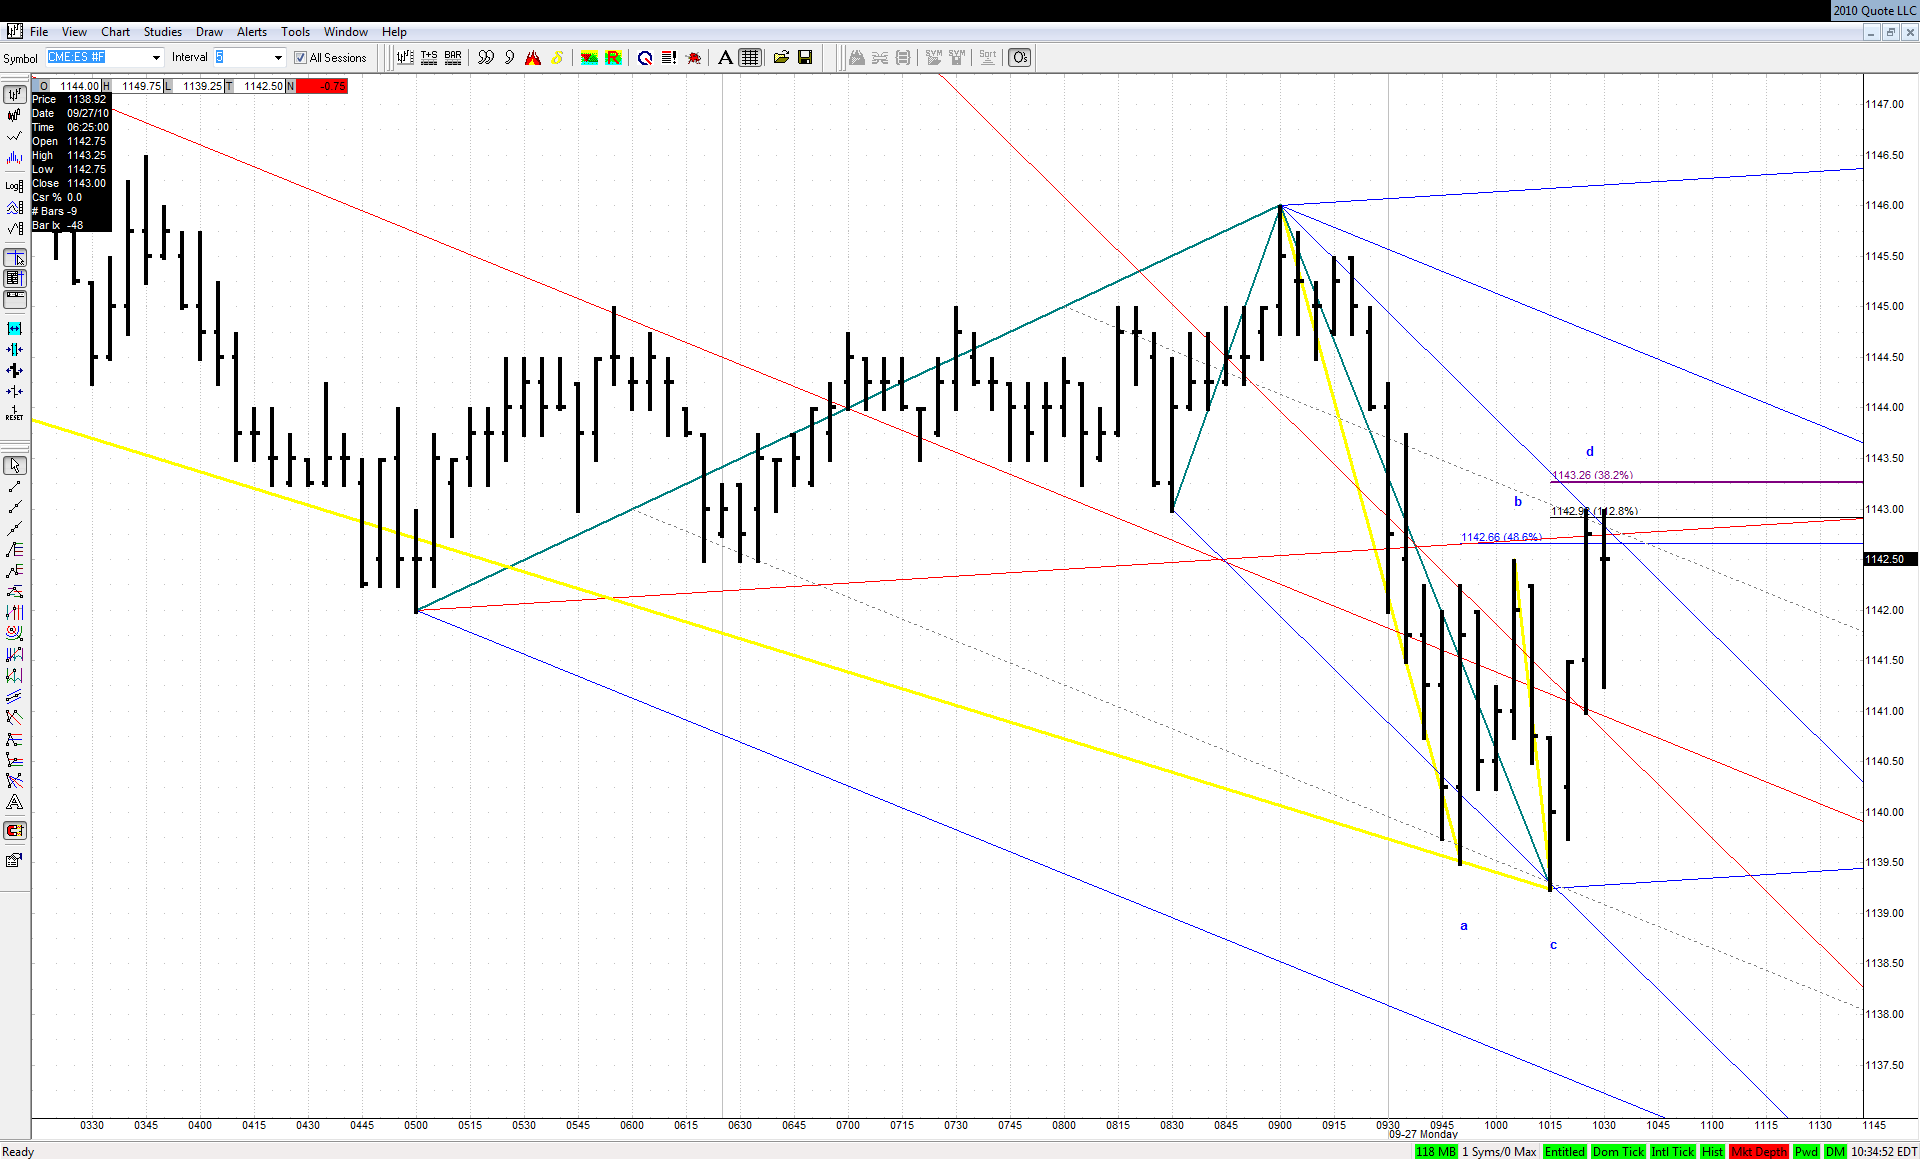
This is not the kind of action one could recently expect on Monday. I'm watching bearish setups very carefully:


Click image for original size
JA
jarek
Rep: 94
Posts: 3,474
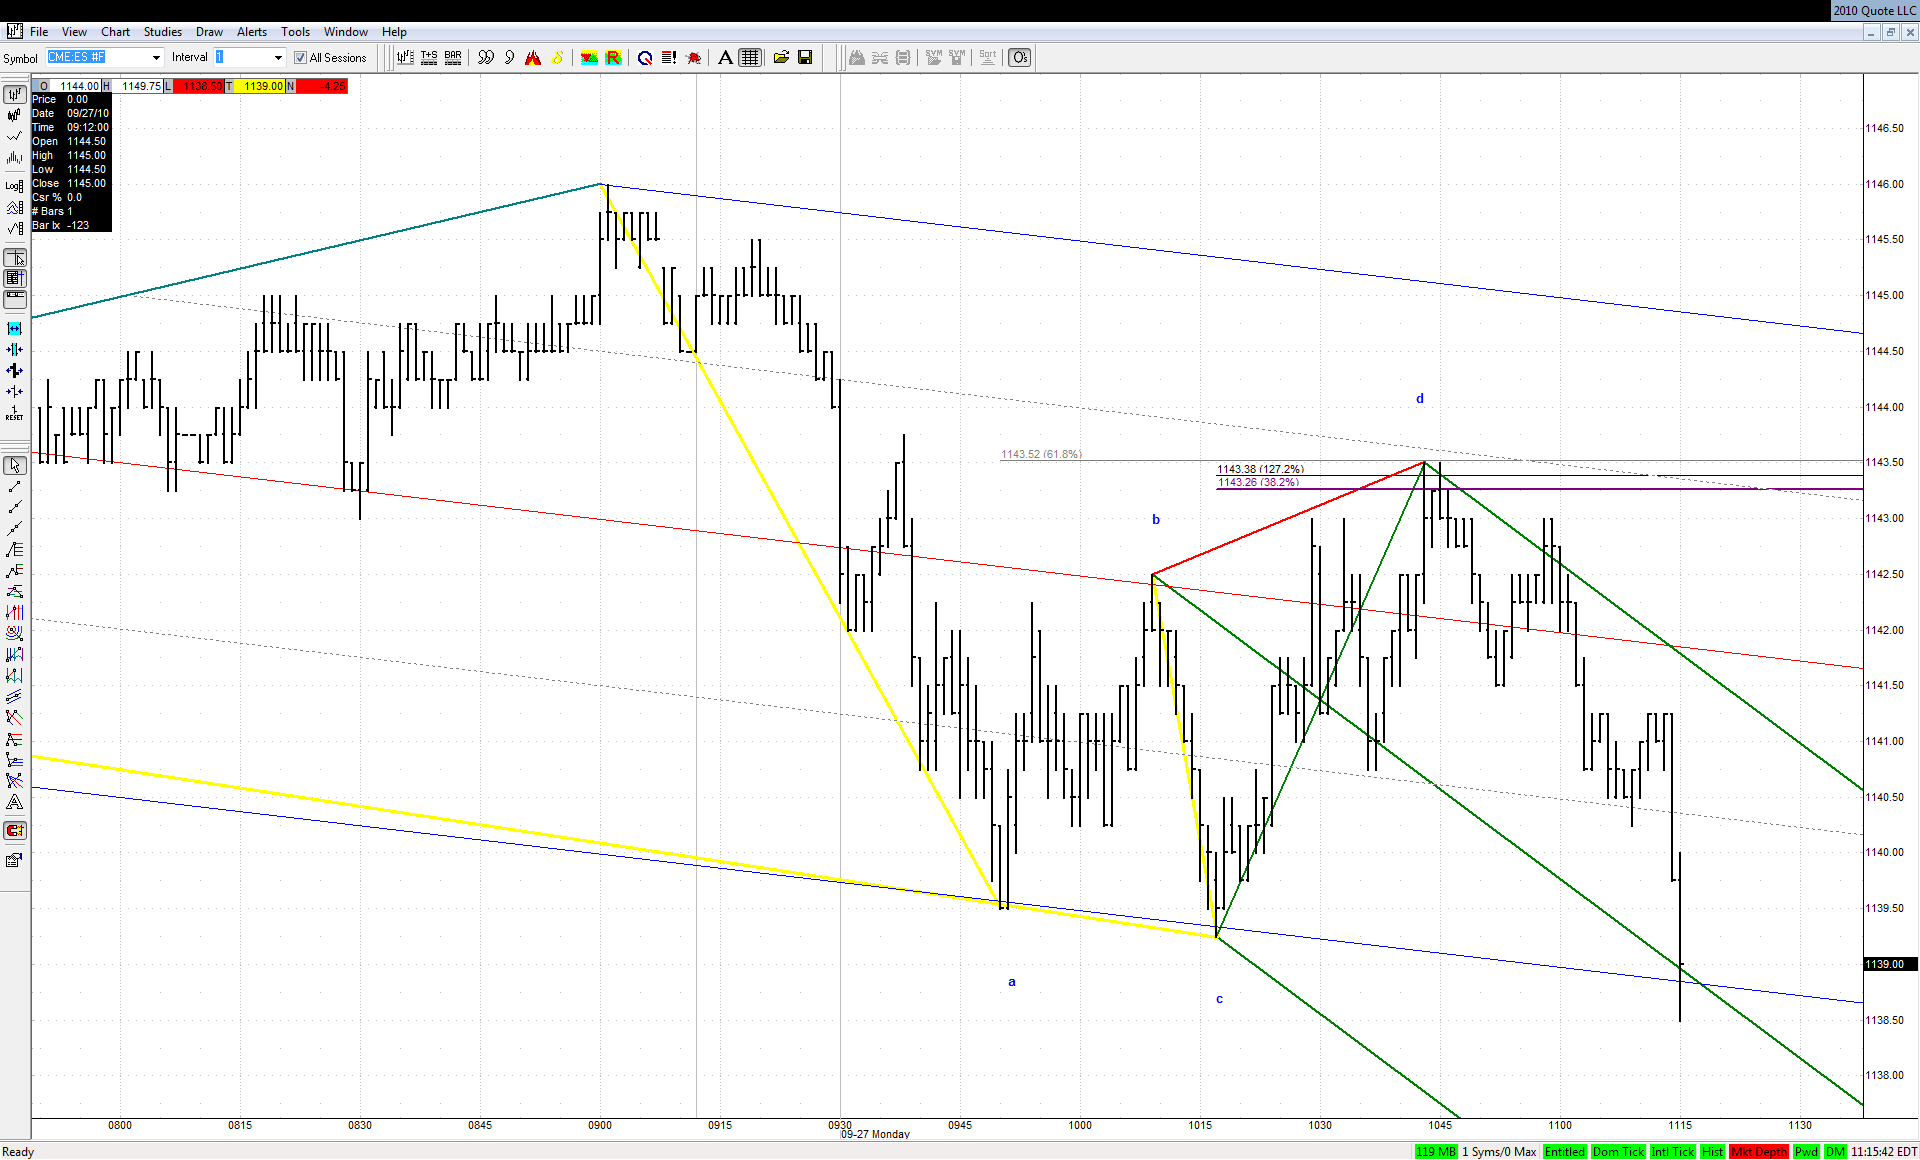
With previous one gone now watching the reaction to DB ABCD:


Click image for original size
JA
jarek
Rep: 94
Posts: 3,474
This is a .382 ABCD so the chances to take out LOD should be close to 90%
JA
jarek
Rep: 94
Posts: 3,474
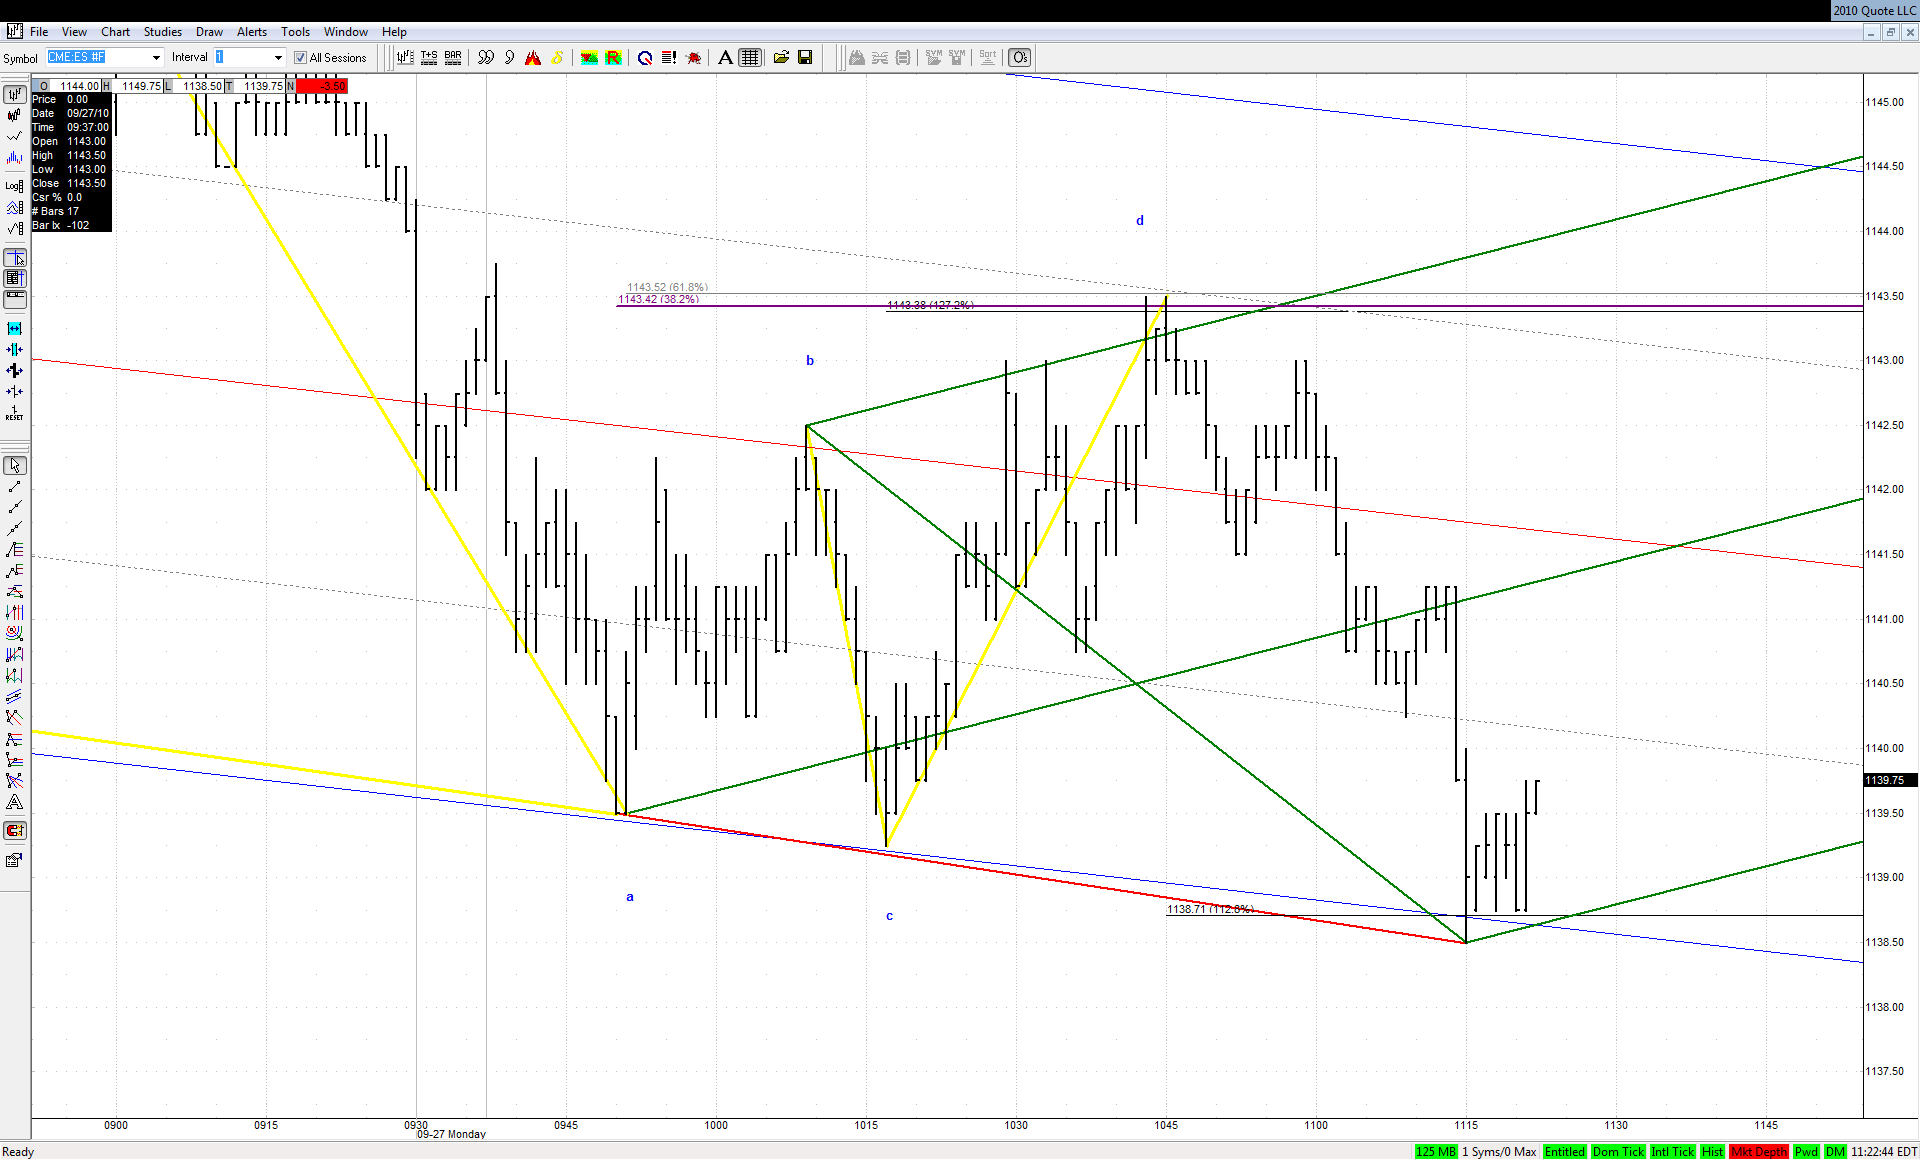
Green line did its magic and pulled the price to new LOD as expected:


Click image for original size


Thanks Roofer!
JA
jarek
Rep: 94
Posts: 3,474
Are the bulls able to get to their green line as well?


Click image for original size
JA
jarek
Rep: 94
Posts: 3,474
Thanks Jim. Have a good weekend!