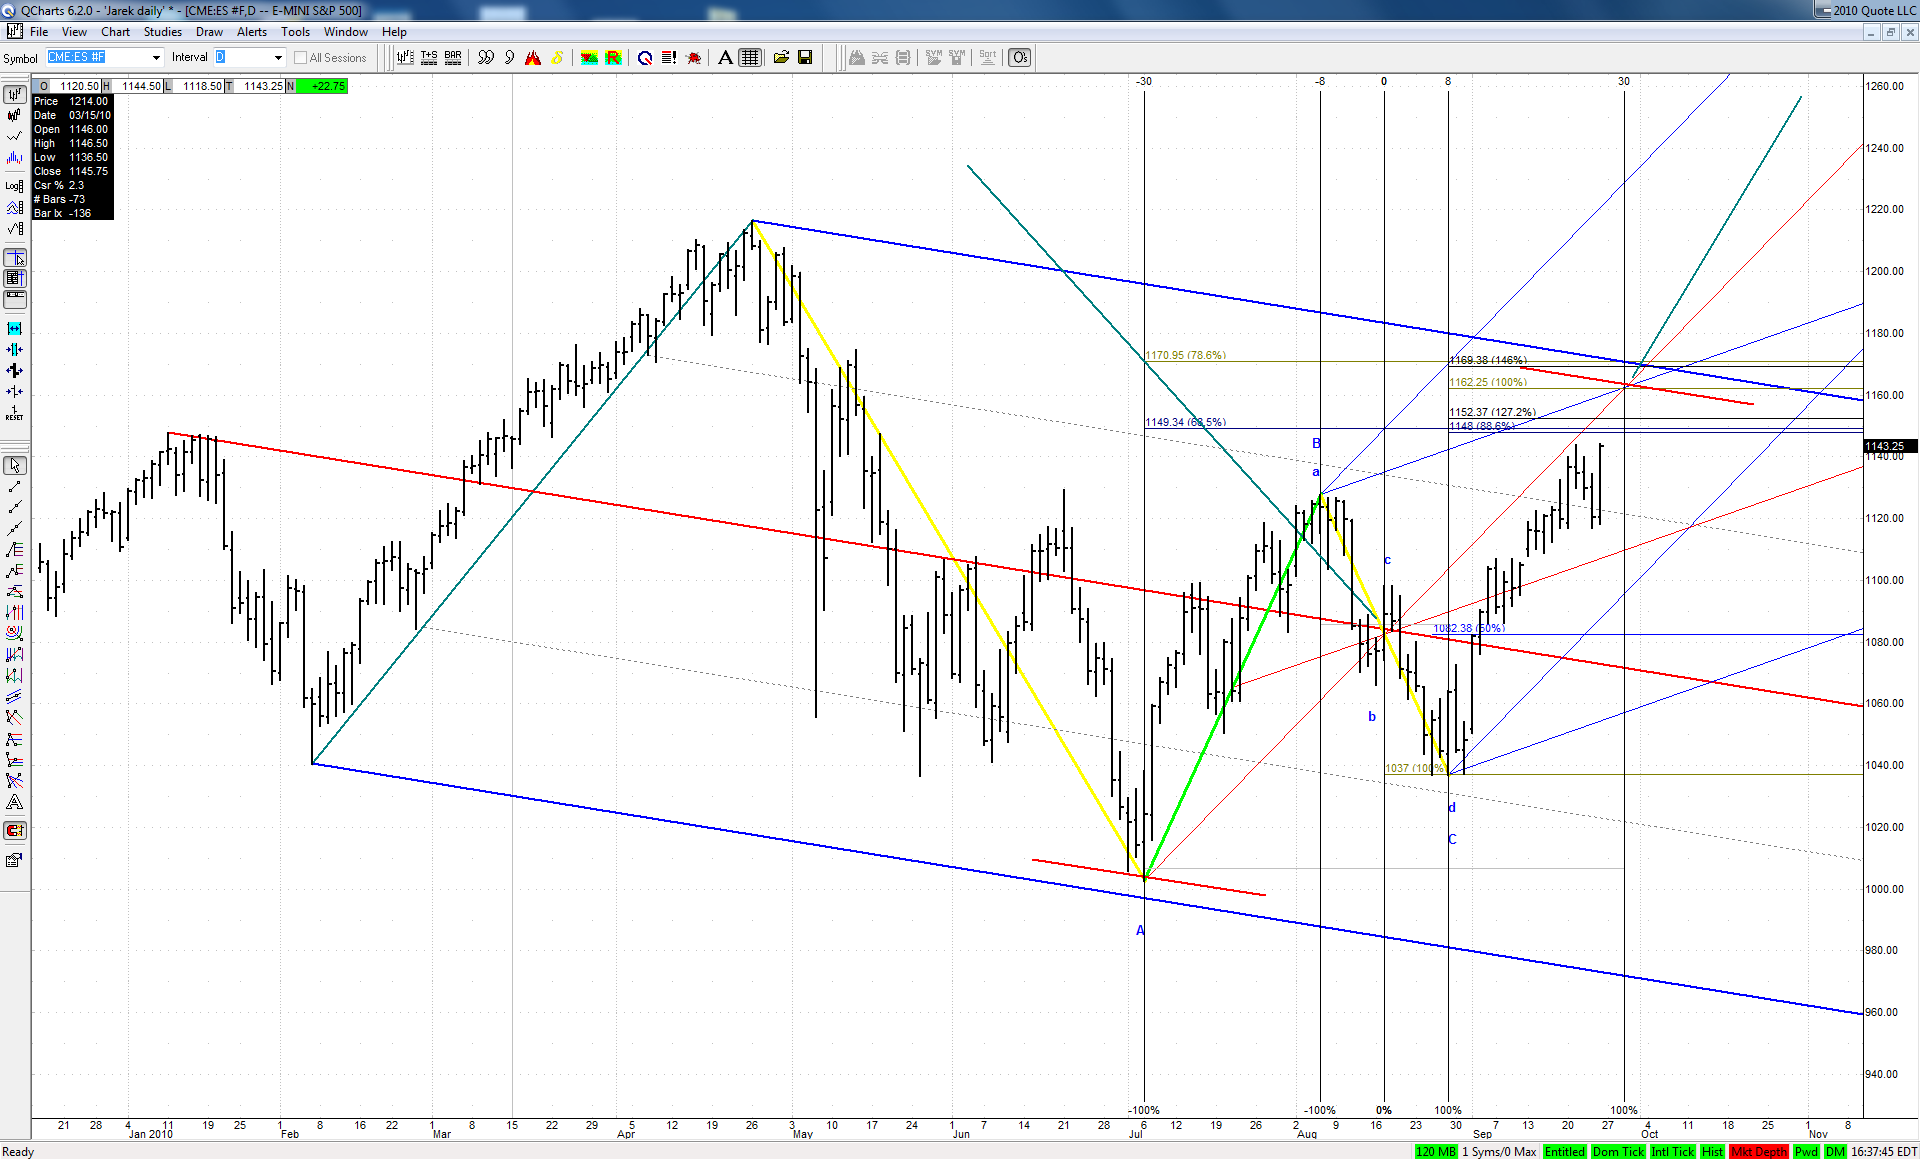
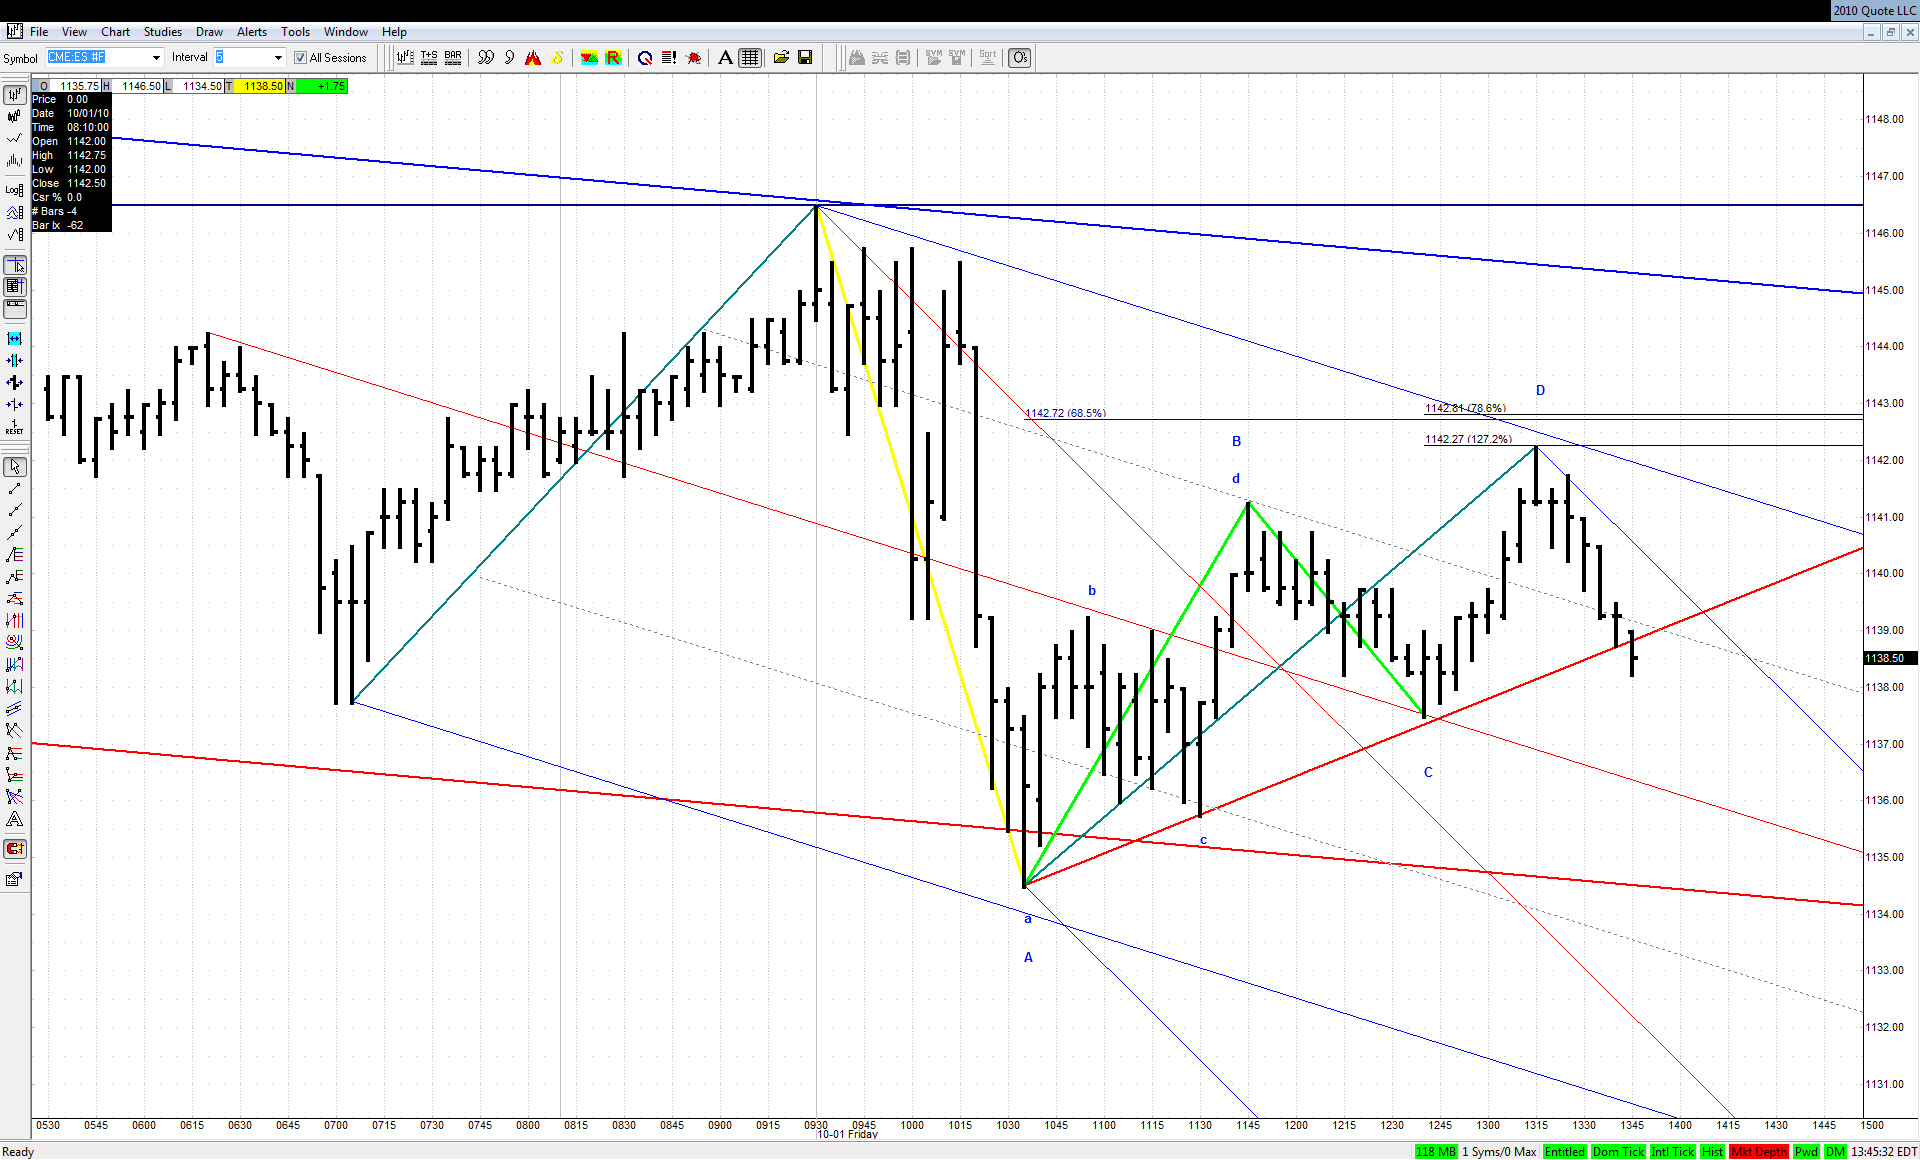
Here is an interesting story. While writing the topic above I was thinking about what chart to show this weekend. Then I noticed that the second date is a palindrome or in some way it is 'symmetrical'. Then I recalled Jim saying that sometimes ABCDs like to be symmetrical around certain point. Then I started digging and ended up with the following chart:
We may see that the BC leg of our current bearish ABCD, which was an ABCD itself was perfectly centered both in price and in time around its 'hub of the wheel' point on August 17th at around 1082 level.
To share the same characteristic the big ABCD should end on September 29th at around 1162 level. What's more interesting - this point is pretty well justified geometrically. Very curious.
JI
jimkane
Rep: 3,058
Posts: 33,089
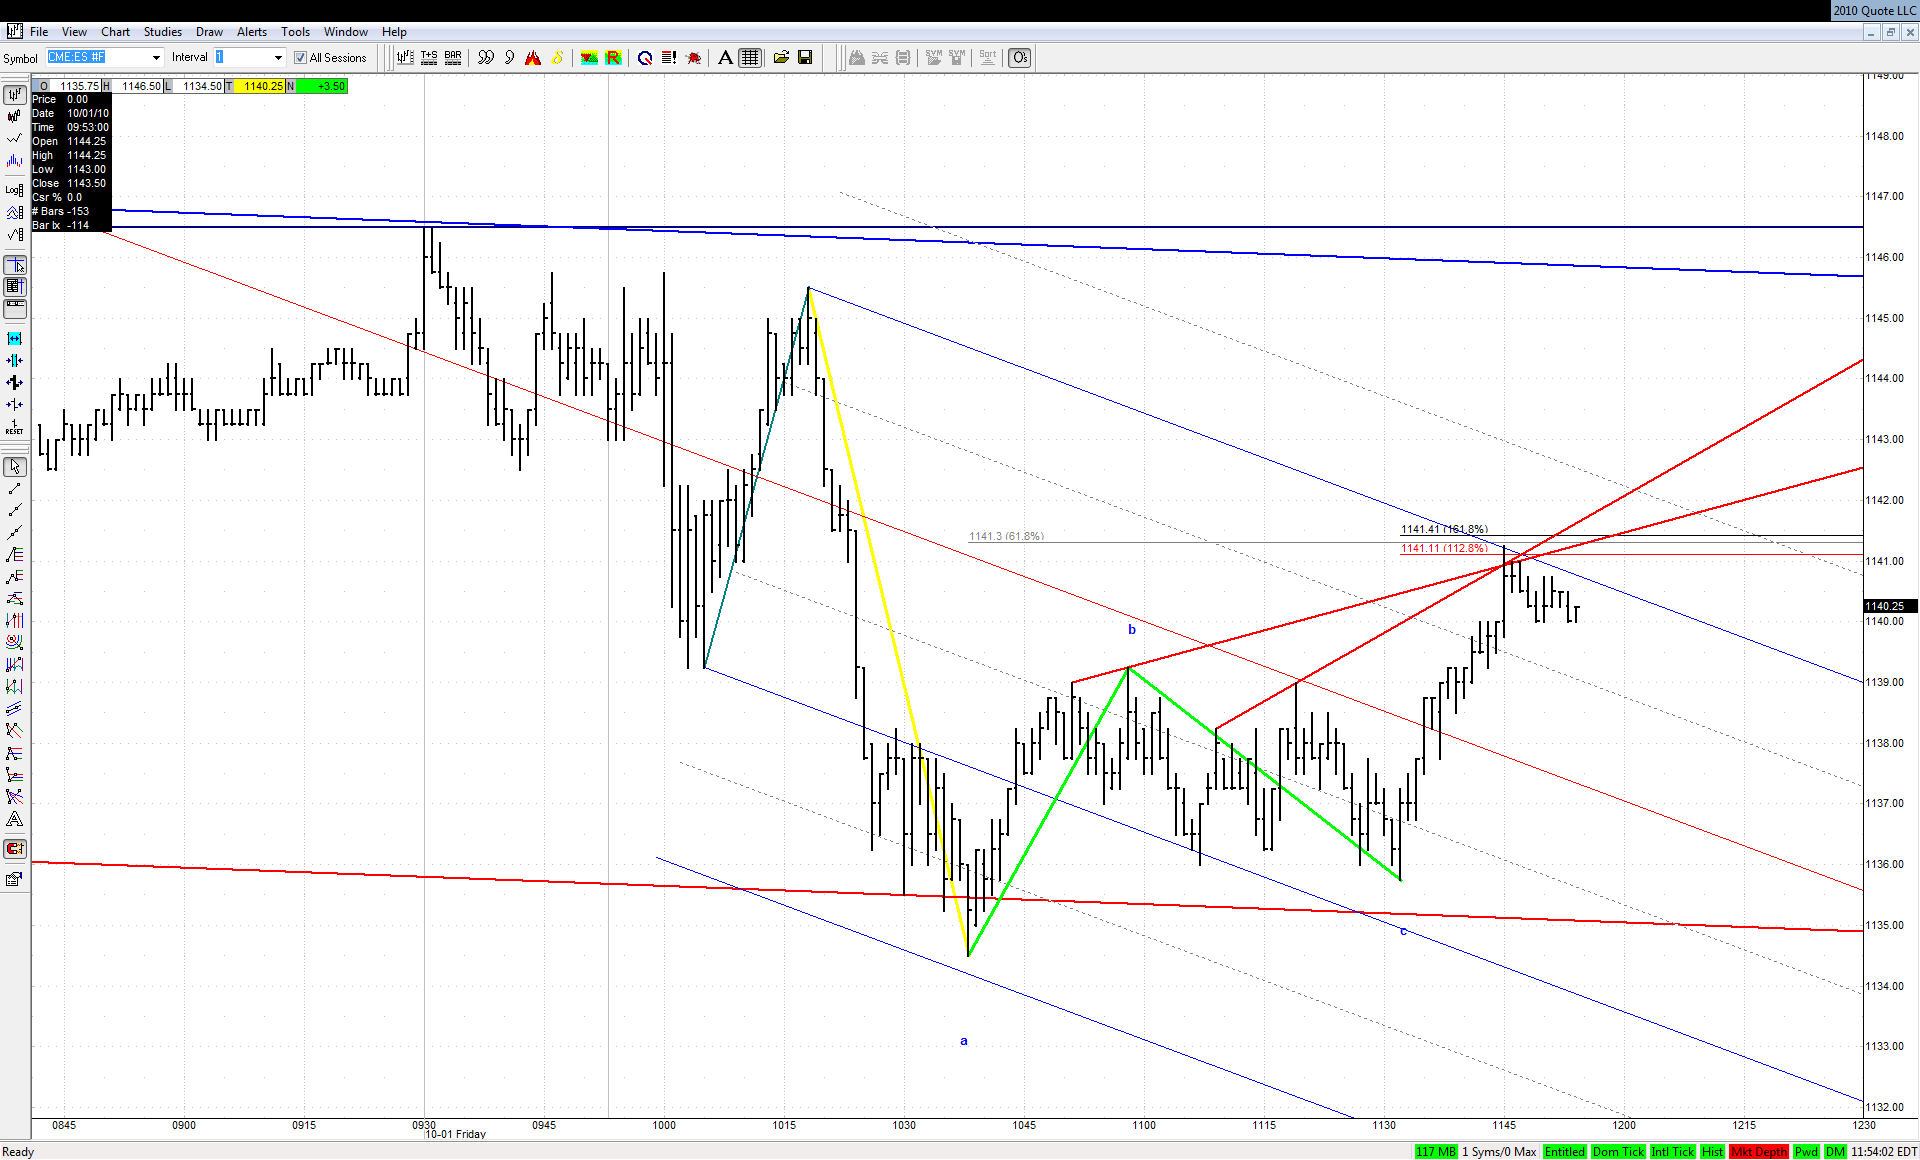
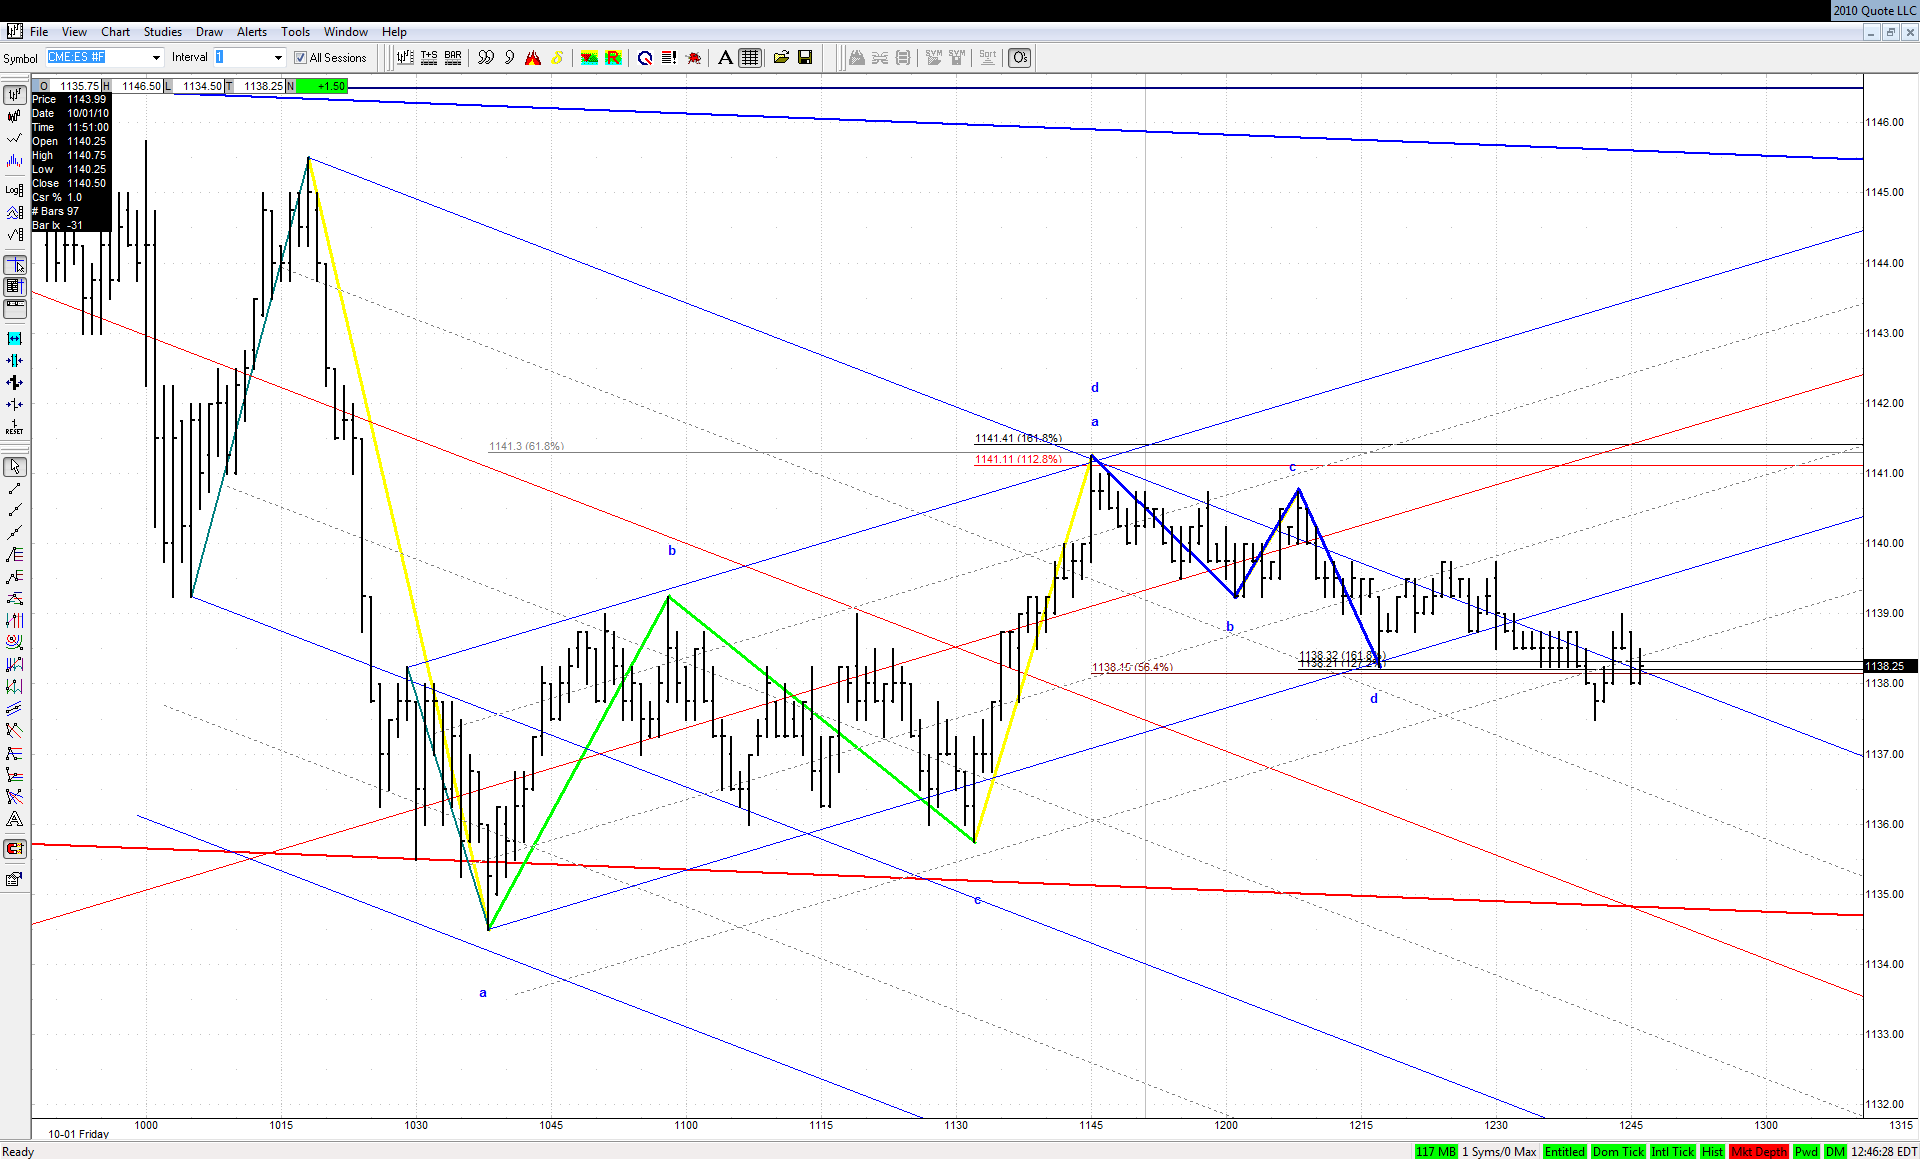
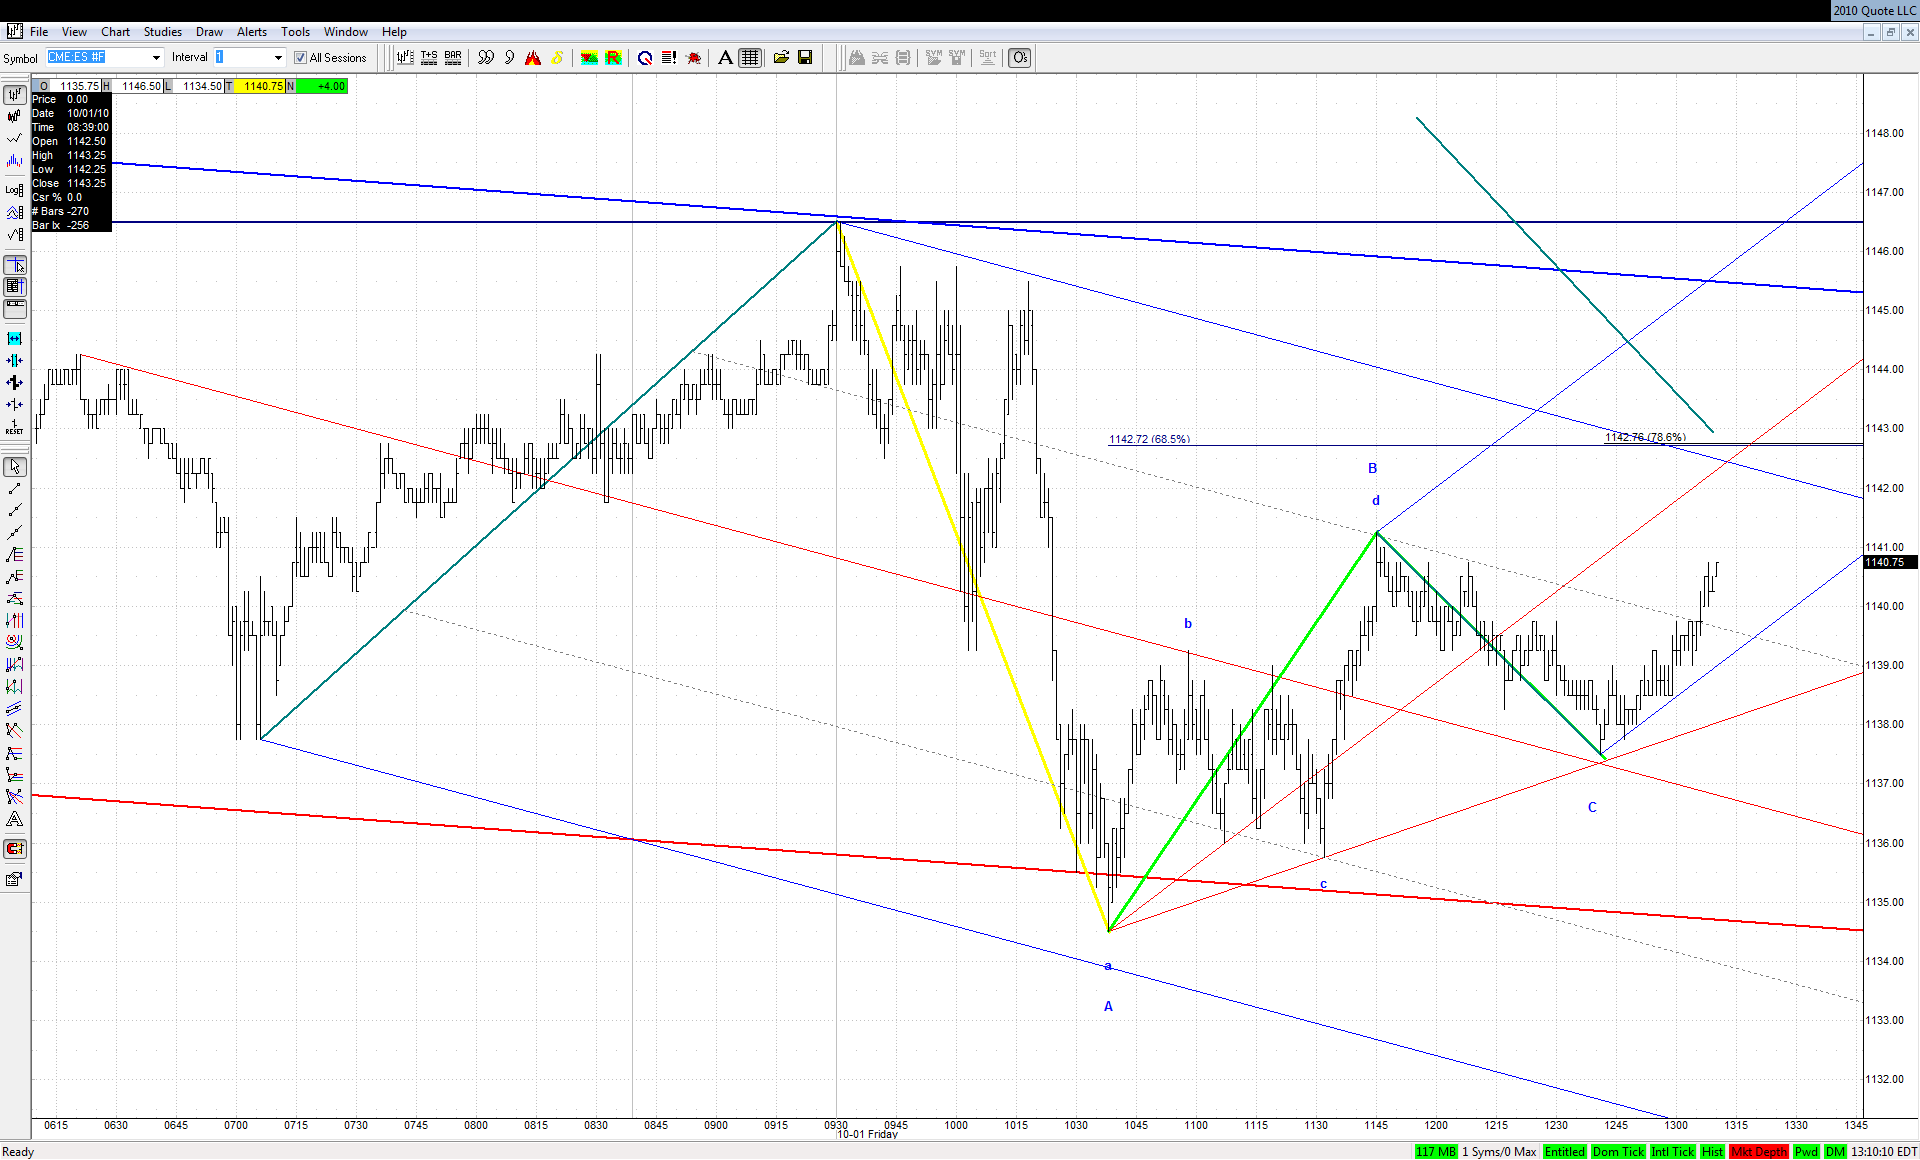
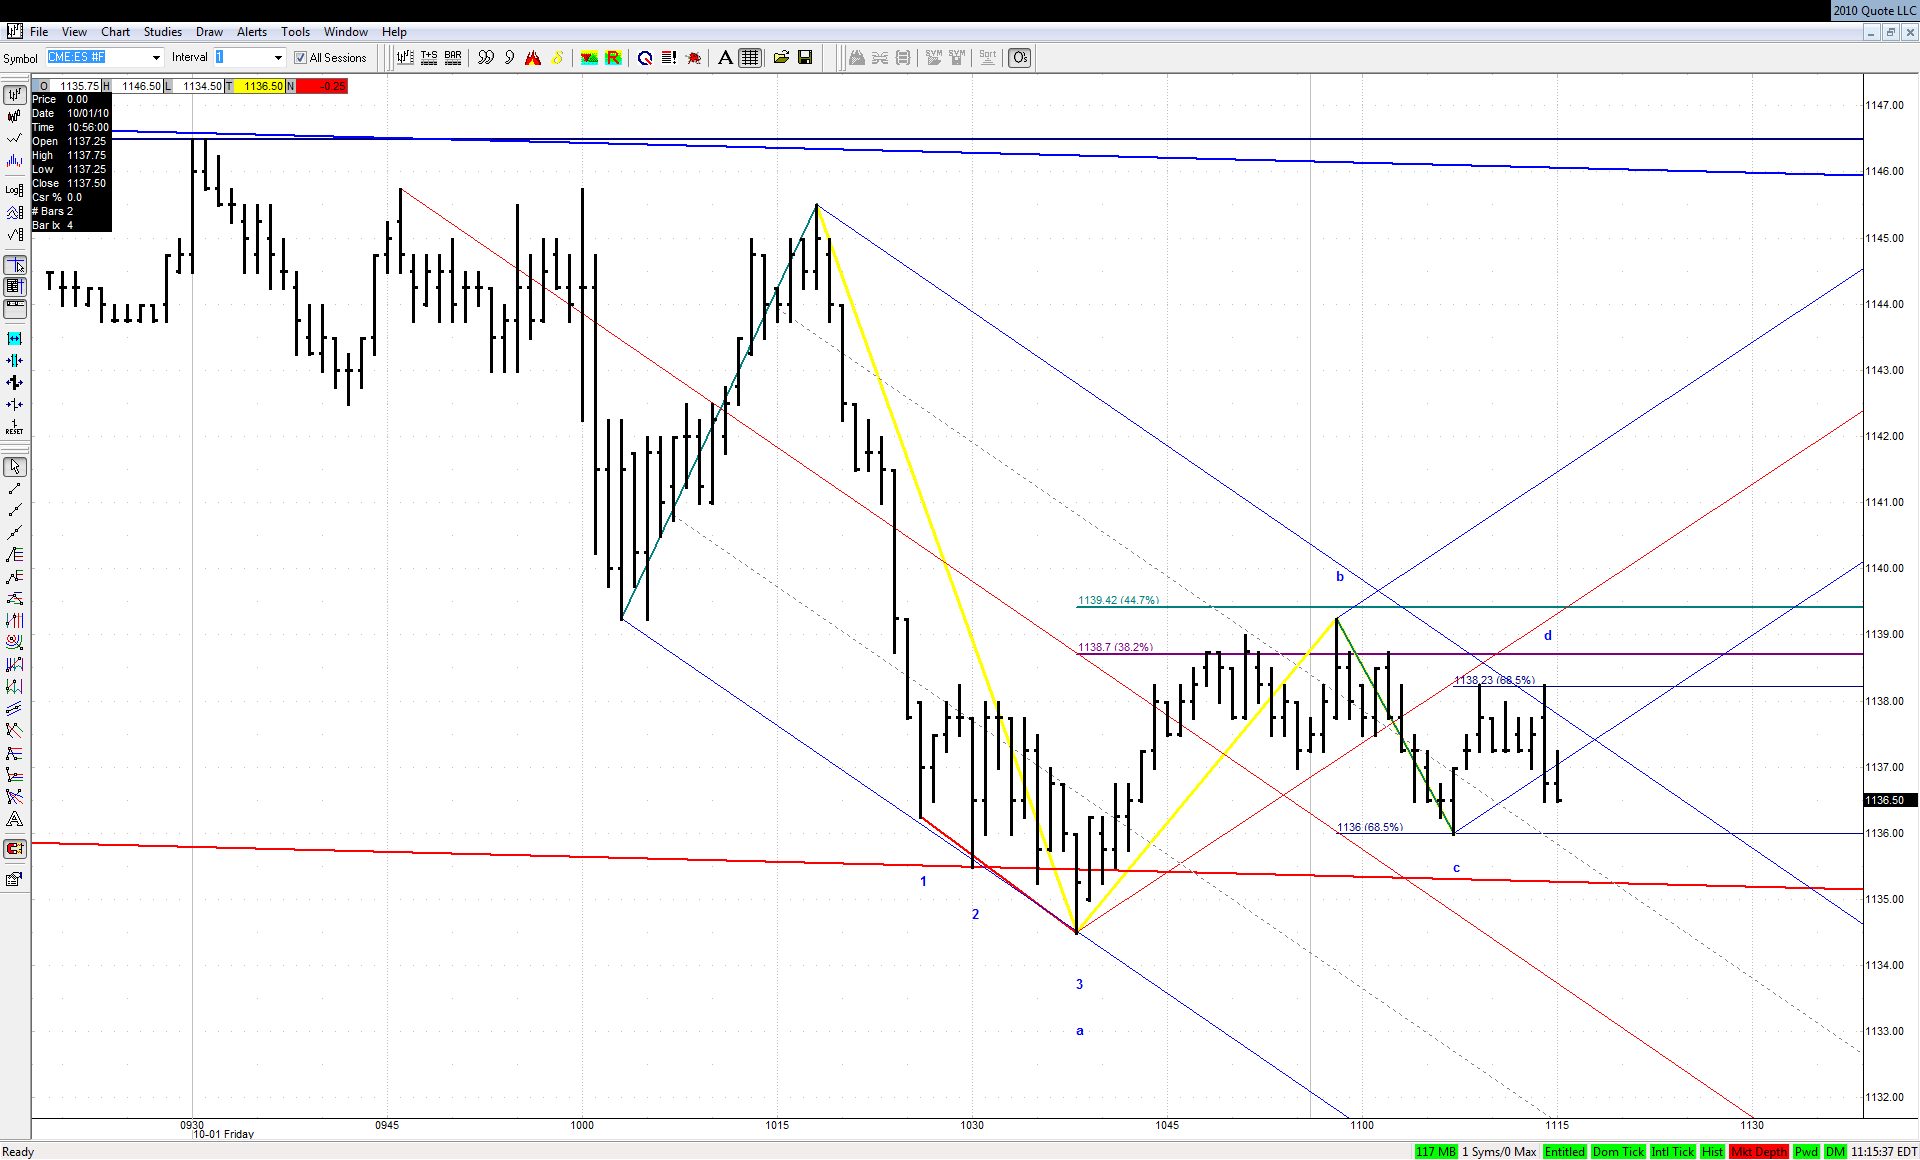
Jarek! I just checked the forum. I figured with you gone, there might not even be any posts. And look at all that excellent work. Great scenario and premise assessments. The last chart really did it. Now it's just ticking below the key TL and area for this first push down. I suspect it is a little mini-trap, and they will start it back up. I'd prefer not, I'd prefer the continuous dump, but that's the way they've been gaming it lately. But up to a new HOD, or up for a 'W2' retest of your last chart area?
JI
jimkane
Rep: 3,058
Posts: 33,089
Darn, you beat me again as I typed that last post... So, 'last chart' now means second last chart.
JI
jimkane
Rep: 3,058
Posts: 33,089
But your last chart (unless you are sneaking another one in as I type...) shows the TL I mentioned, and the break slightly through it. Watch for the snap up.
JA
jarek
Rep: 94
Posts: 3,474
Originally posted by jimkane
But your last chart (unless you are sneaking another one in as I type...)