MyPivots
Sign In
JA
jarek
Rep: 94
Posts: 3,474
Here is an interesting story. While writing the topic above I was thinking about what chart to show this weekend. Then I noticed that the second date is a palindrome or in some way it is 'symmetrical'. Then I recalled Jim saying that sometimes ABCDs like to be symmetrical around certain point. Then I started digging and ended up with the following chart:


Click image for original size
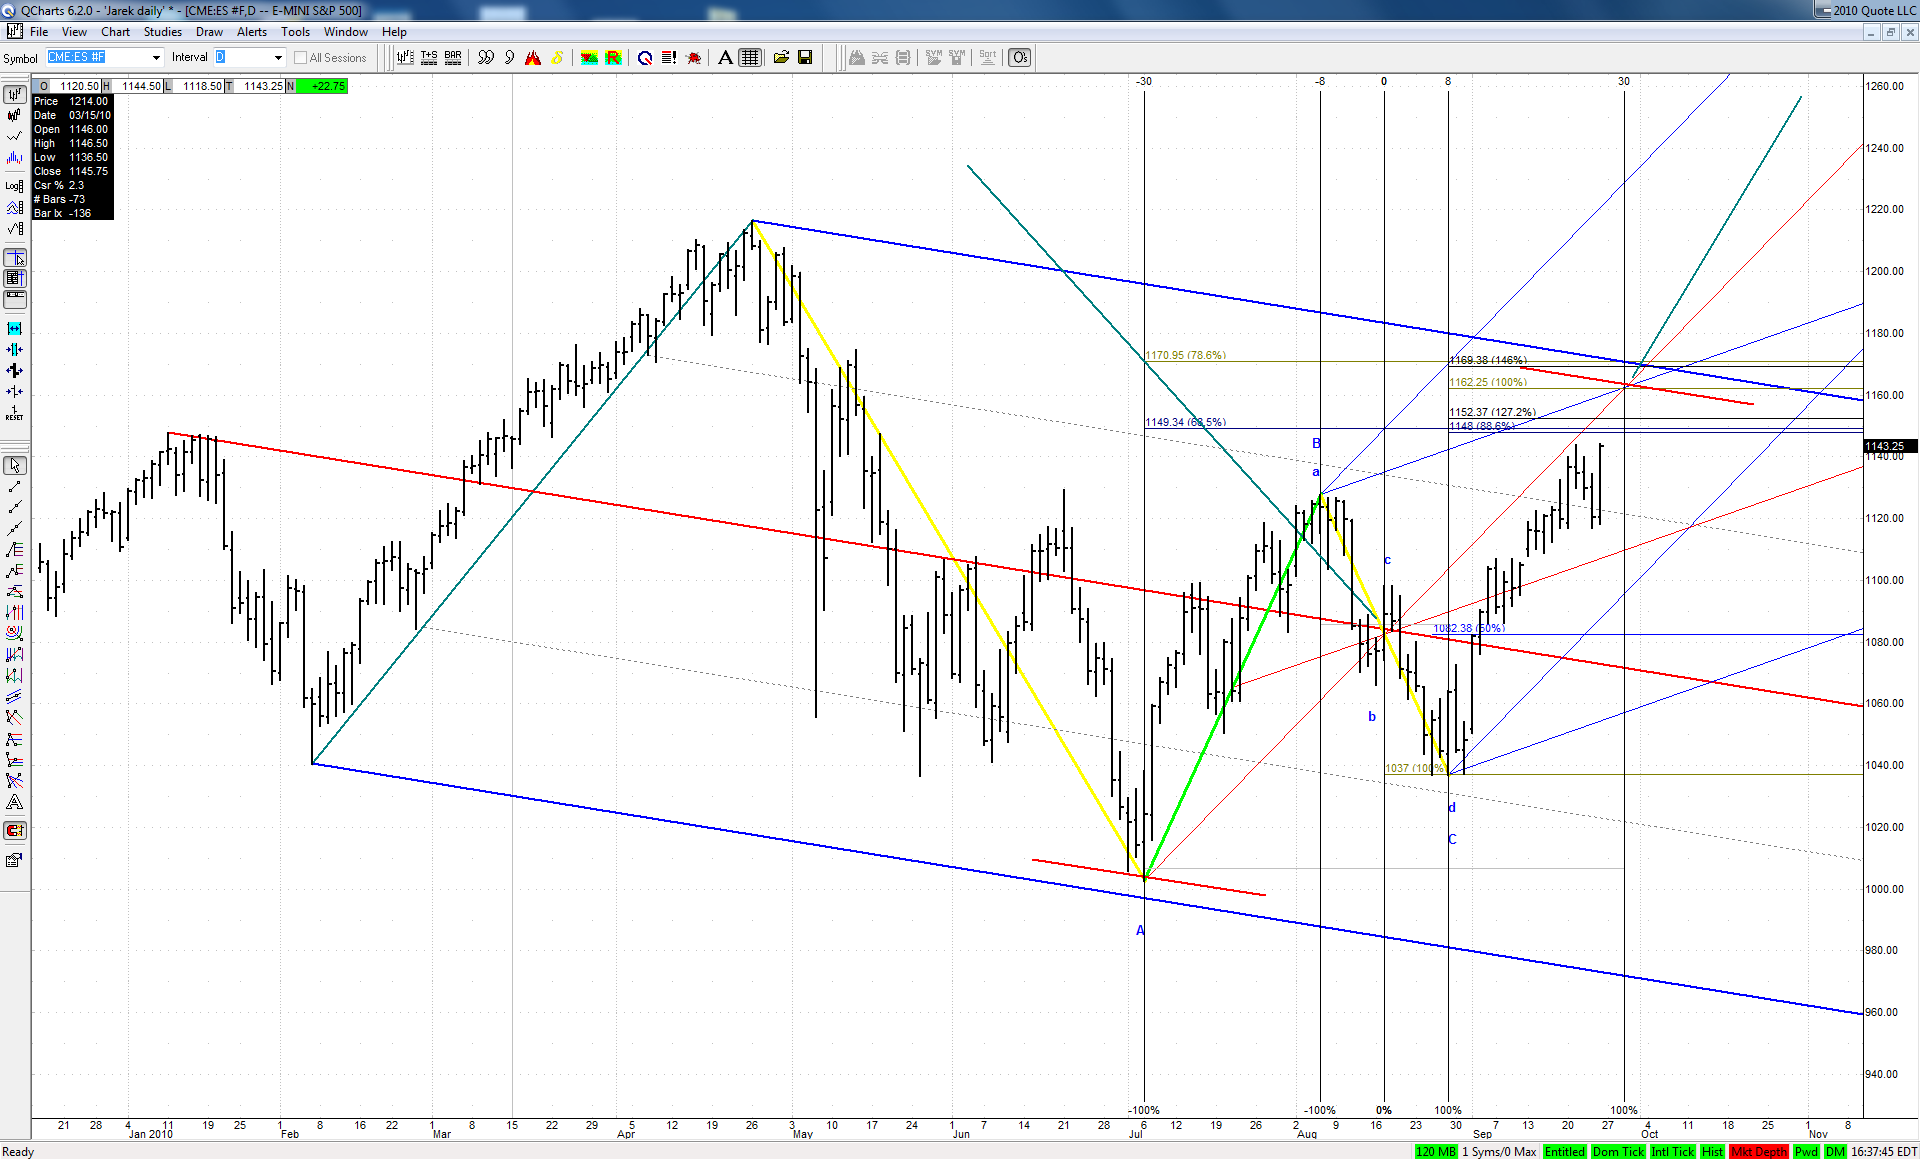


We may see that the BC leg of our current bearish ABCD, which was an ABCD itself was perfectly centered both in price and in time around its 'hub of the wheel' point on August 17th at around 1082 level.
To share the same characteristic the big ABCD should end on September 29th at around 1162 level. What's more interesting - this point is pretty well justified geometrically. Very curious.
JA
jarek
Rep: 94
Posts: 3,474
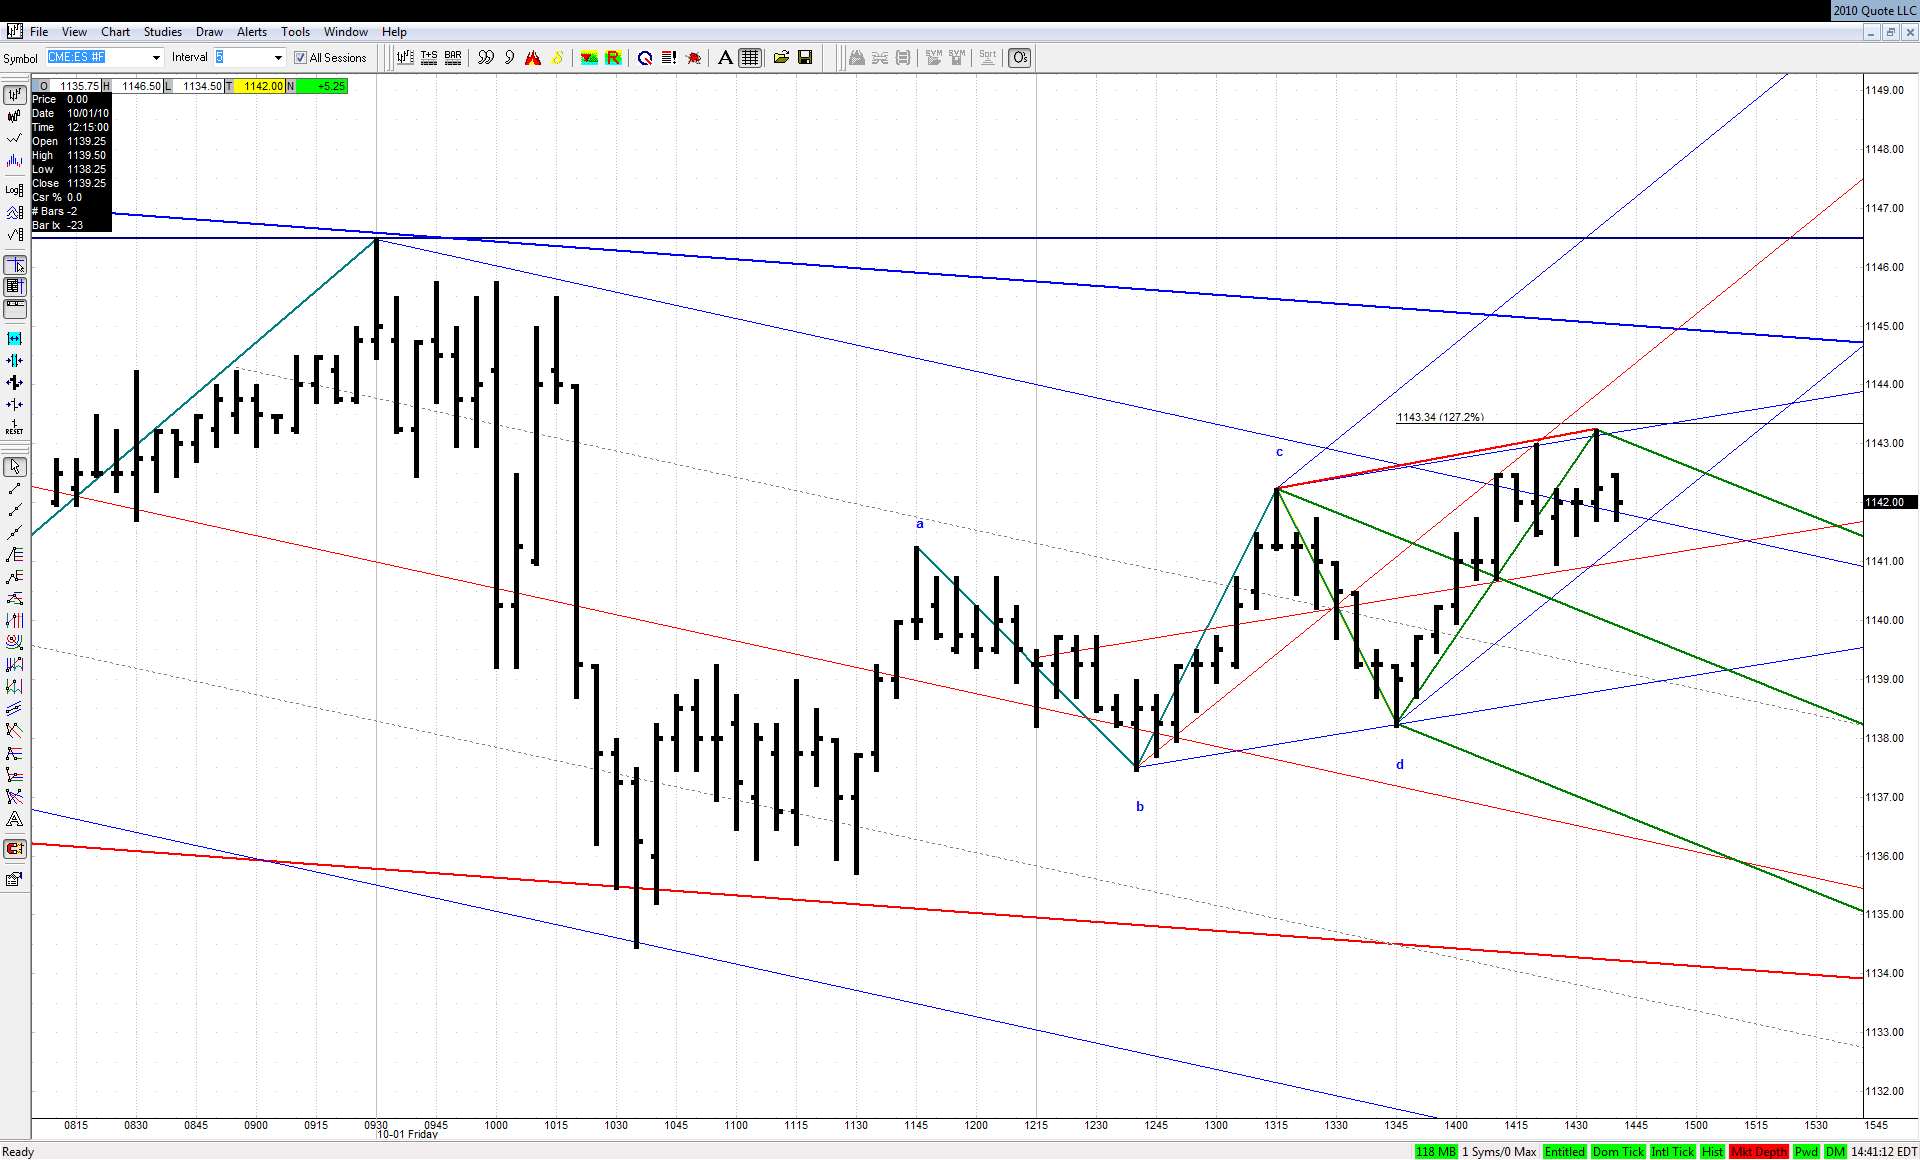
Will they at least allow the green set to play out?


Click image for original size
JI
jimkane
Rep: 3,058
Posts: 33,089
Don't get me wrong, I want it to dump here more than anything, I just know how much they want 'up' at all times, and how they often turn corrective grind into impulsive. Recall how TL creep was almost 100% in my experience (for it to break the line), until Mar '09 in the ES, when it broke up and away from the line almost 100%.
JI
jimkane
Rep: 3,058
Posts: 33,089
Watch the 15-min TL.
JI
jimkane
Rep: 3,058
Posts: 33,089
I jut can't imagine they will be happy with anything but a run until close, bursting up and over that key 15-min TL.
JA
jarek
Rep: 94
Posts: 3,474
So we are back at Schiff's upper ML from my first chart today. There is a possible big bearish ABCD, where our TD would be a BC leg:


Click image for original size


But that would require 2 failed Sunday/Monday's in a row - a low probability event.
JI
jimkane
Rep: 3,058
Posts: 33,089
+10 for that last post. That's also the TL I am referring to, and it doesn't like it one bit. On the other hand, maybe since no one expects two down Sunday/Monday's in a row, maybe that is now the most likely outcome? This thing may still want one more thrust up to hit your big daily chart area in the 60's. I'm keeping that in mind as a likely scenario (I'm still not convinced this won't rise essentially nonstop until November).
JA
jarek
Rep: 94
Posts: 3,474
Here is a closer look at this setup which is clearly 'seen':


Click image for original size
JI
jimkane
Rep: 3,058
Posts: 33,089
Okay, they left it for Sunday night right at the key area. My guess is a gap up and over the area on the open. Or an open at even and then the fast rush up and over. We'll see. Great week for charts in here, jarek.
JA
jarek
Rep: 94
Posts: 3,474
Thanks Jim. Have a good weekend!