MyPivots
Sign In
JA
jarek
Rep: 94
Posts: 3,474
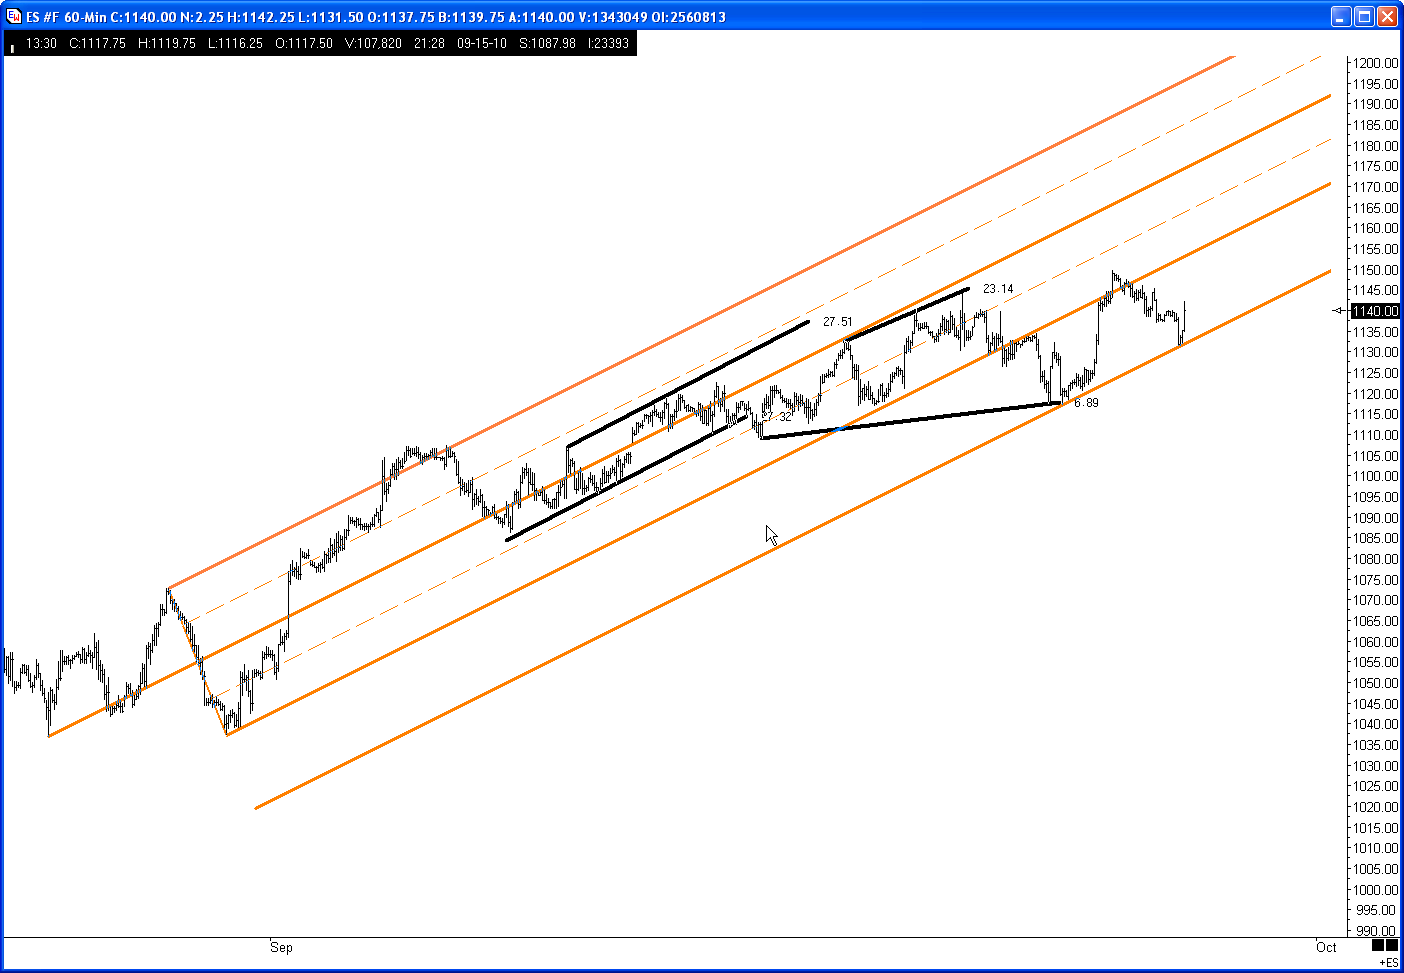
Here is an interesting story. While writing the topic above I was thinking about what chart to show this weekend. Then I noticed that the second date is a palindrome or in some way it is 'symmetrical'. Then I recalled Jim saying that sometimes ABCDs like to be symmetrical around certain point. Then I started digging and ended up with the following chart:


Click image for original size
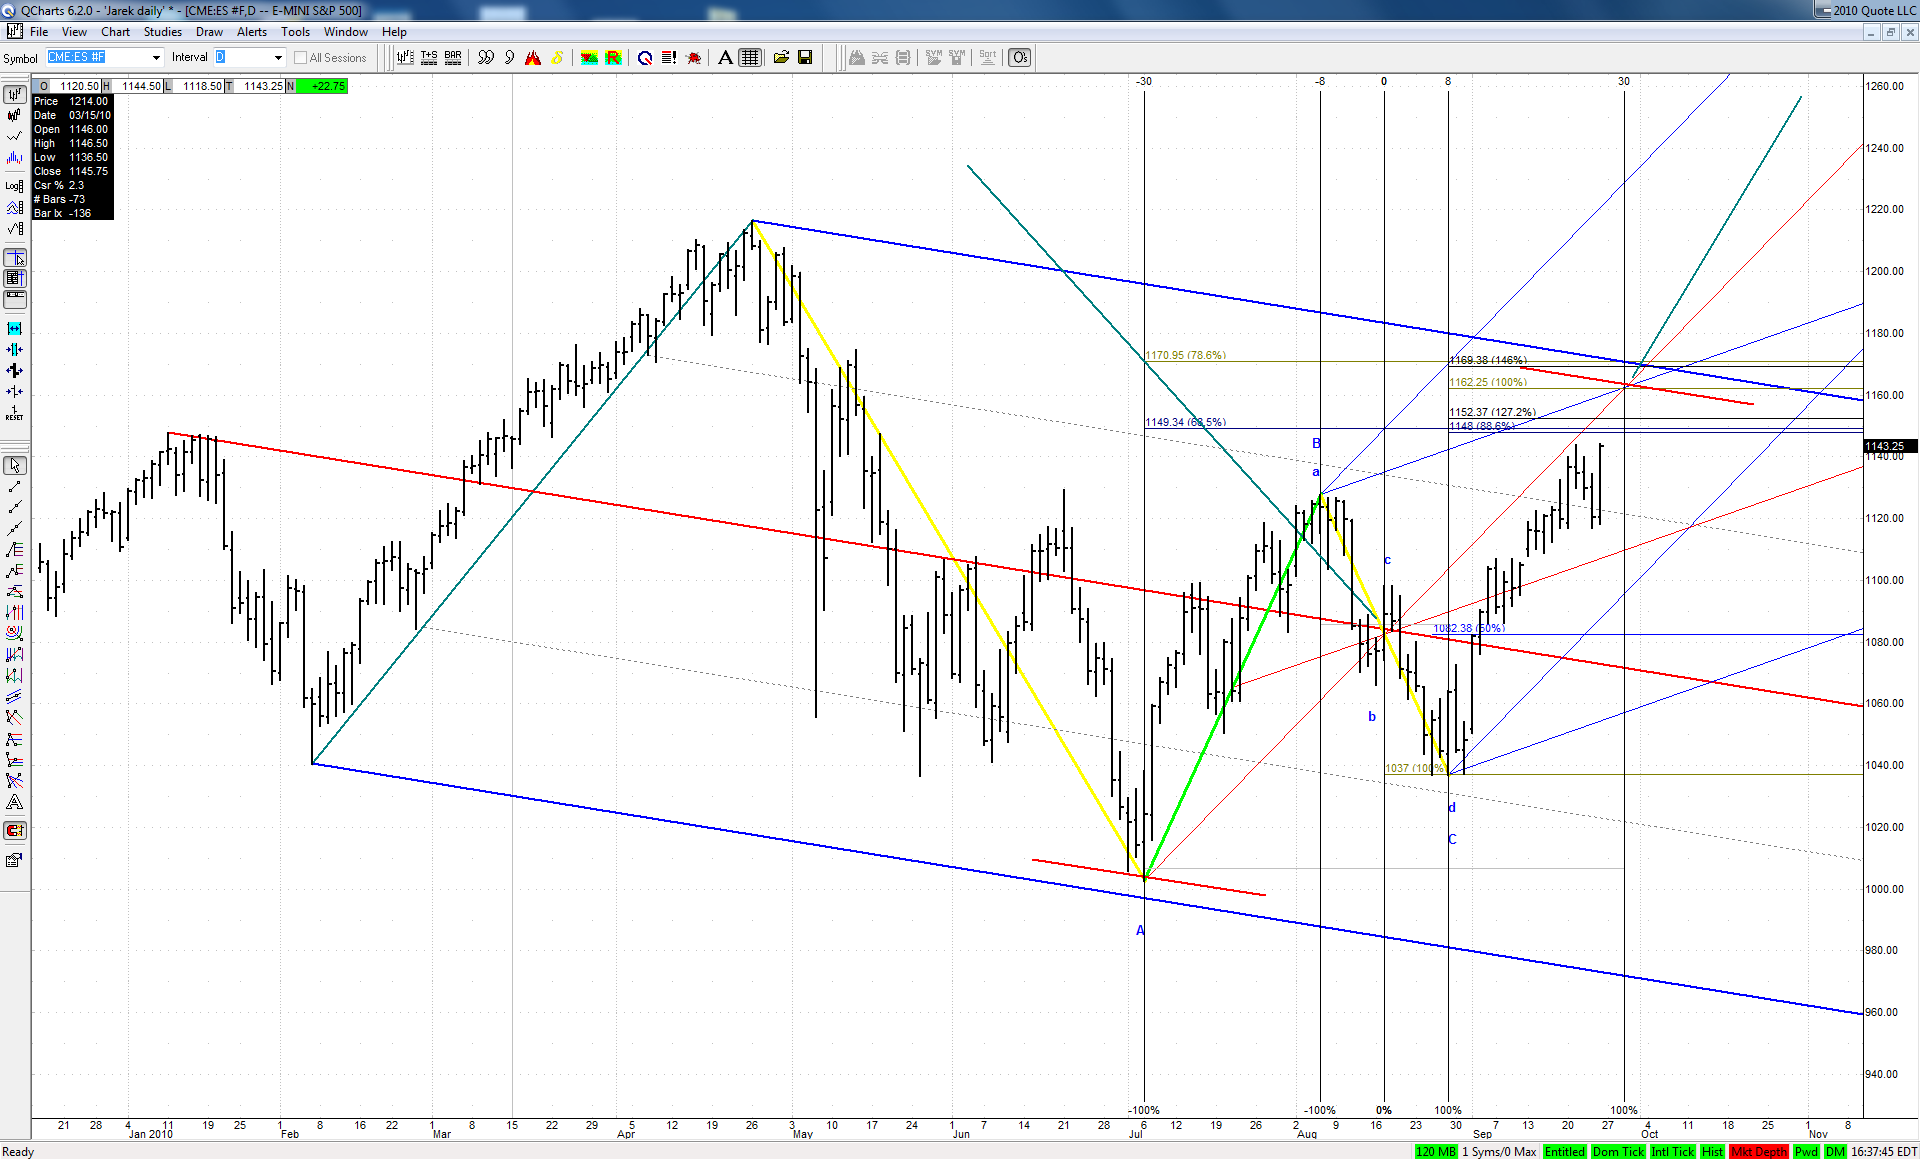


We may see that the BC leg of our current bearish ABCD, which was an ABCD itself was perfectly centered both in price and in time around its 'hub of the wheel' point on August 17th at around 1082 level.
To share the same characteristic the big ABCD should end on September 29th at around 1162 level. What's more interesting - this point is pretty well justified geometrically. Very curious.
JI
jimkane
Rep: 3,058
Posts: 33,089
Nice to have you back, Al.

So, here's what I'd like people to take from today. I was long side bias, ready for a ride until close typical up Monday (even after the rocky GLOBEX selling, which was a big clue that things may not follow that path). I saw this potential trap setting up. I decided the trap would be too good for them to pass up, and I wasn't convinced the odds favored taking a lot of heat on that long side, waiting for an upside resolution.

So, I came up with a new premise, which meant getting off that long side, getting over to the short side, and watching for certain clues as to how things were unfolding. The layout and where the clues might come all factored in to the new premise. As it turns out, the new premise and the read were spot on. The flexibility and willingness to not stay married to an ongoing premise is the lesson for the day, laid out essentially in real time in here for everyone to follow. Pretty cool, in my opinion.
ER
EricD
Rep: 63
Posts: 692
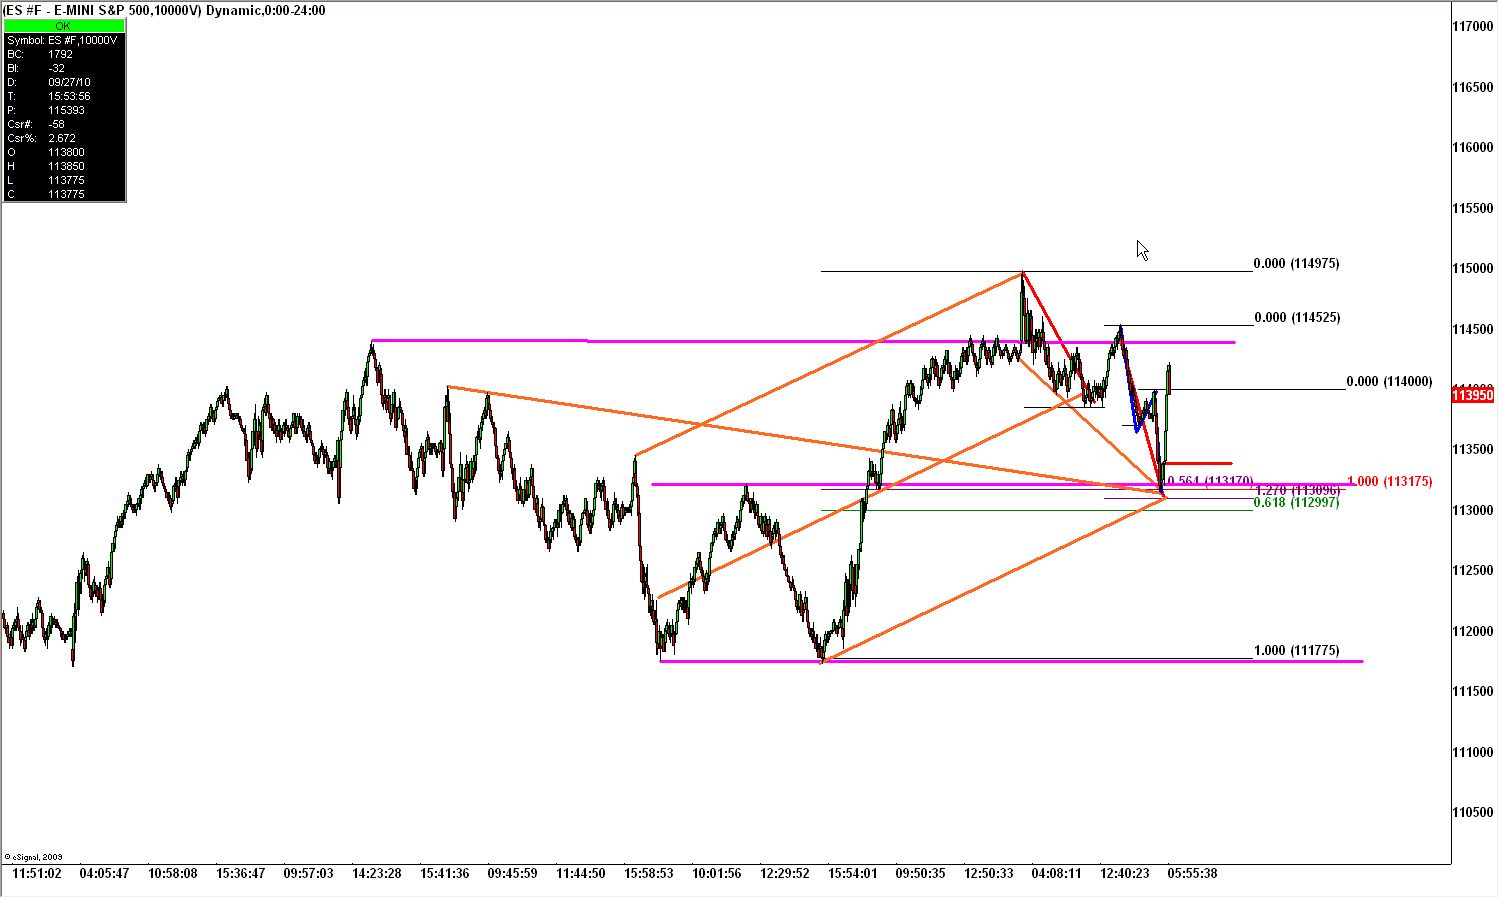
"The Night Crawler Trading"
Click image for original size

Click image for original size

Click image for original size
JA
jarek
Rep: 94
Posts: 3,474
Well done Eric! I already lost from sight this upsloping set on the middle chart and you proved that it is still in play.
Time for the final ascent to the 'symmetrical' target from my weekend post?
ER
EricD
Rep: 63
Posts: 692
Thanks Jarek...the pattern is developing. If we cant clear the 43-46 area then I would say odds favor a larger correction. Possibly down to the 1123.50-21 , 16-14 areas. That confluence up there is sure an attractor though.
JA
jarek
Rep: 94
Posts: 3,474
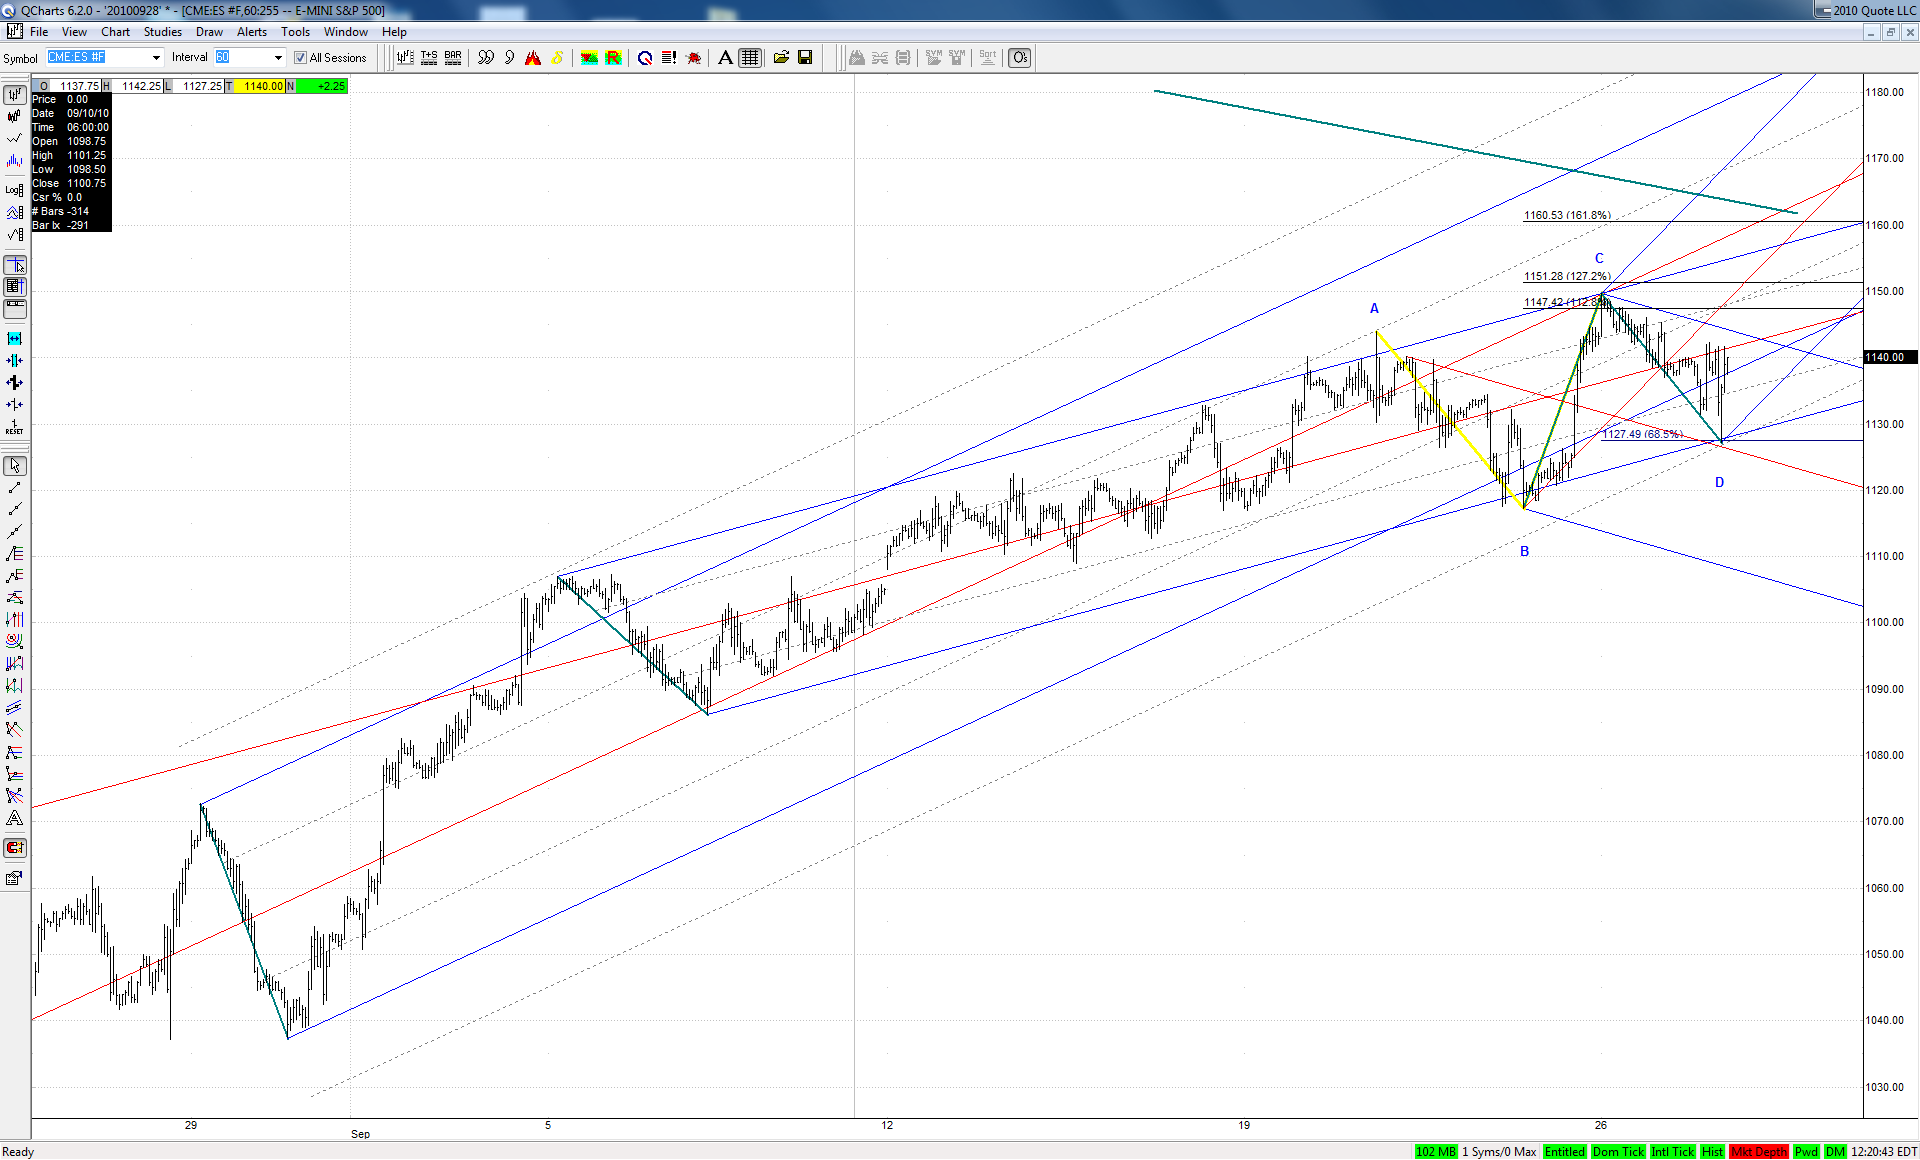
I can imagine that this bullish TD ABCD could be our really last W4 on the way up:


Click image for original size


A climax move to the target tomorrow would be required here and that would fit rather well to the scenario of a bigger reversal.
JA
jarek
Rep: 94
Posts: 3,474
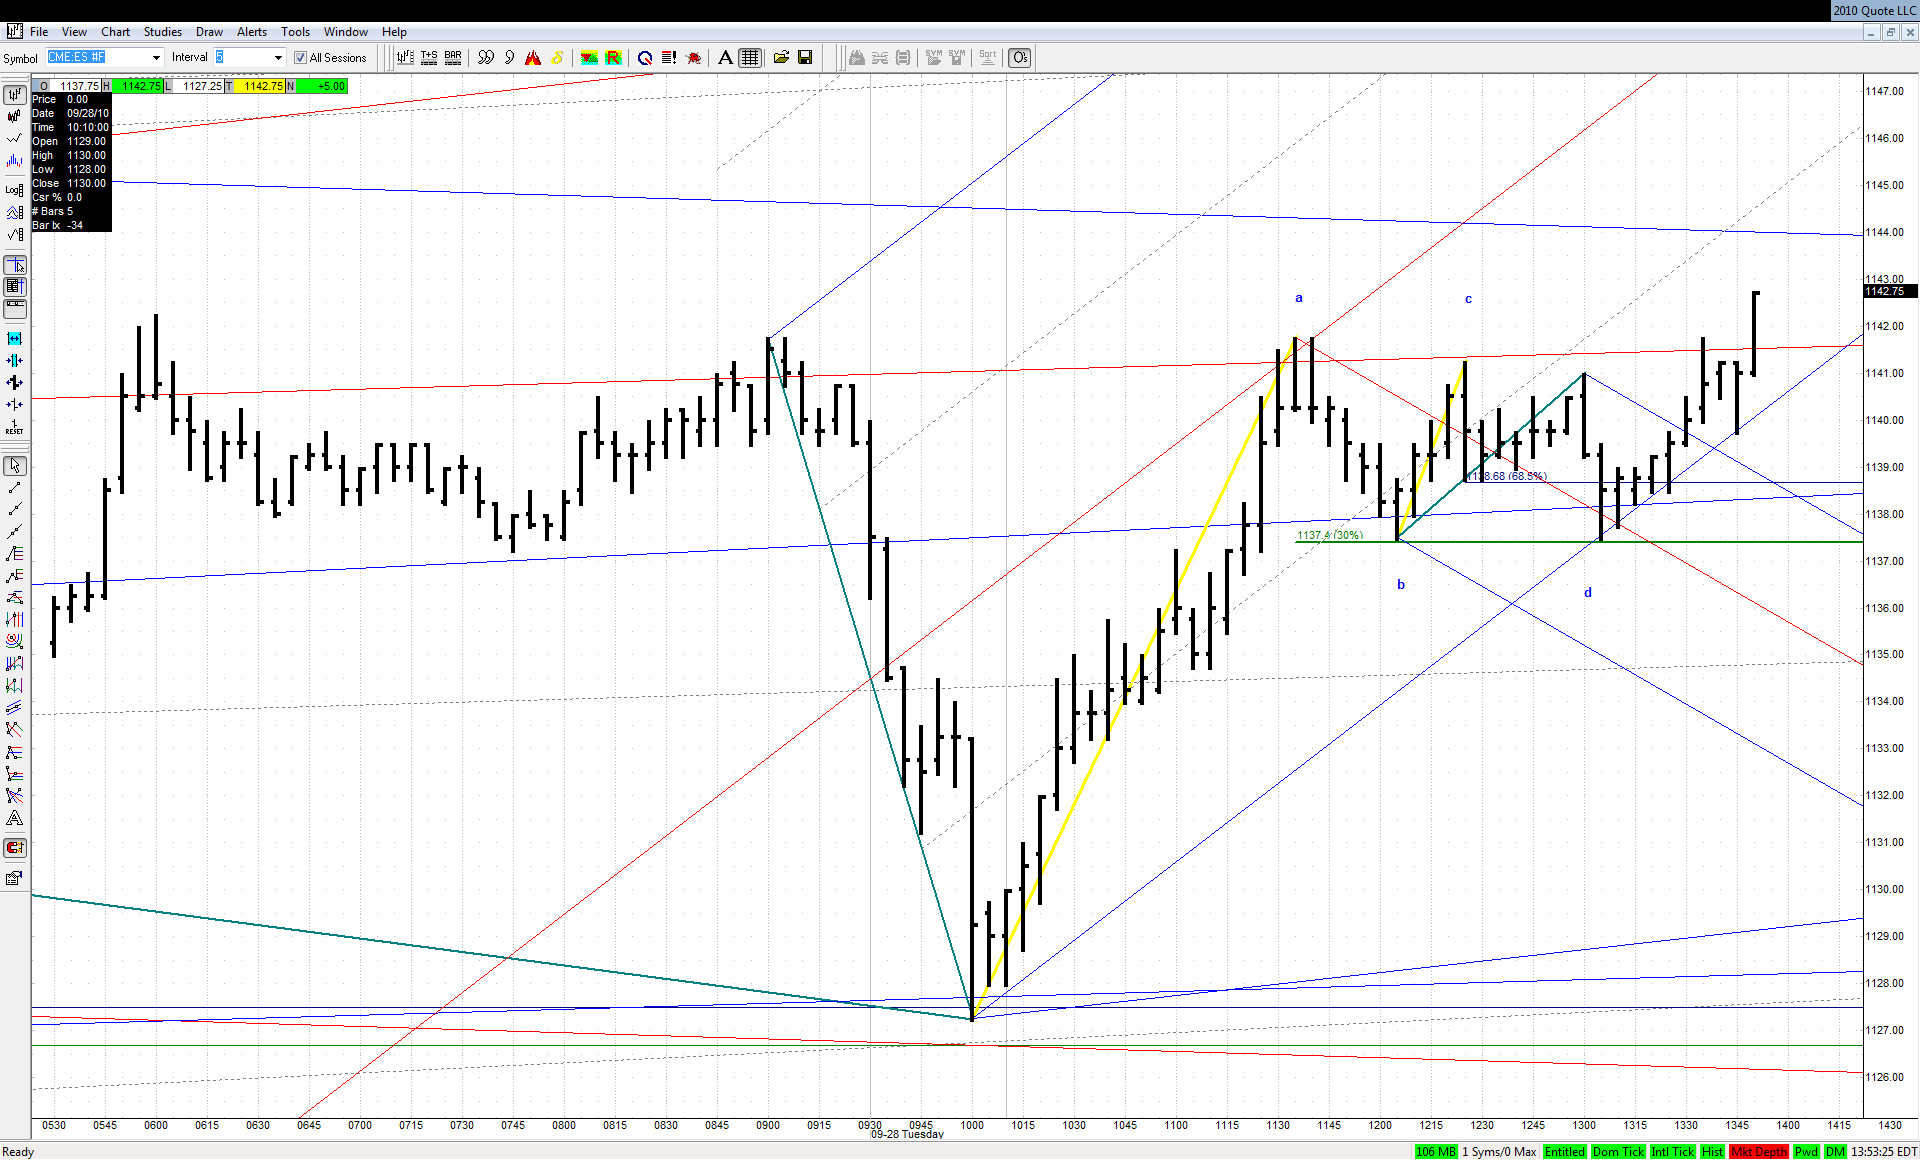
Still looking strong. Just .300 correction on the way up:


Click image for original size
JA
jarek
Rep: 94
Posts: 3,474
The Flat above was clearly a small W4 that played to 1.460. Here in the 'Kane Zone' comes the test of today's uptrend:


Click image for original size
JI
jimkane
Rep: 3,058
Posts: 33,089
If they are planning to come back in, here's the spot I'd most expect it. That's a big if, though. A bounce and roll would be really nice.
JI
jimkane
Rep: 3,058
Posts: 33,089
Darn, you beat me by four minutes. I didn't even see your post when I posted mine. Back to normal, after those rare beats I did on you yesterday.
JI
jimkane
Rep: 3,058
Posts: 33,089
Okay, who's long? Anyone? Bueller?
JA
jarek
Rep: 94
Posts: 3,474
Thanks Jim. Have a good weekend!