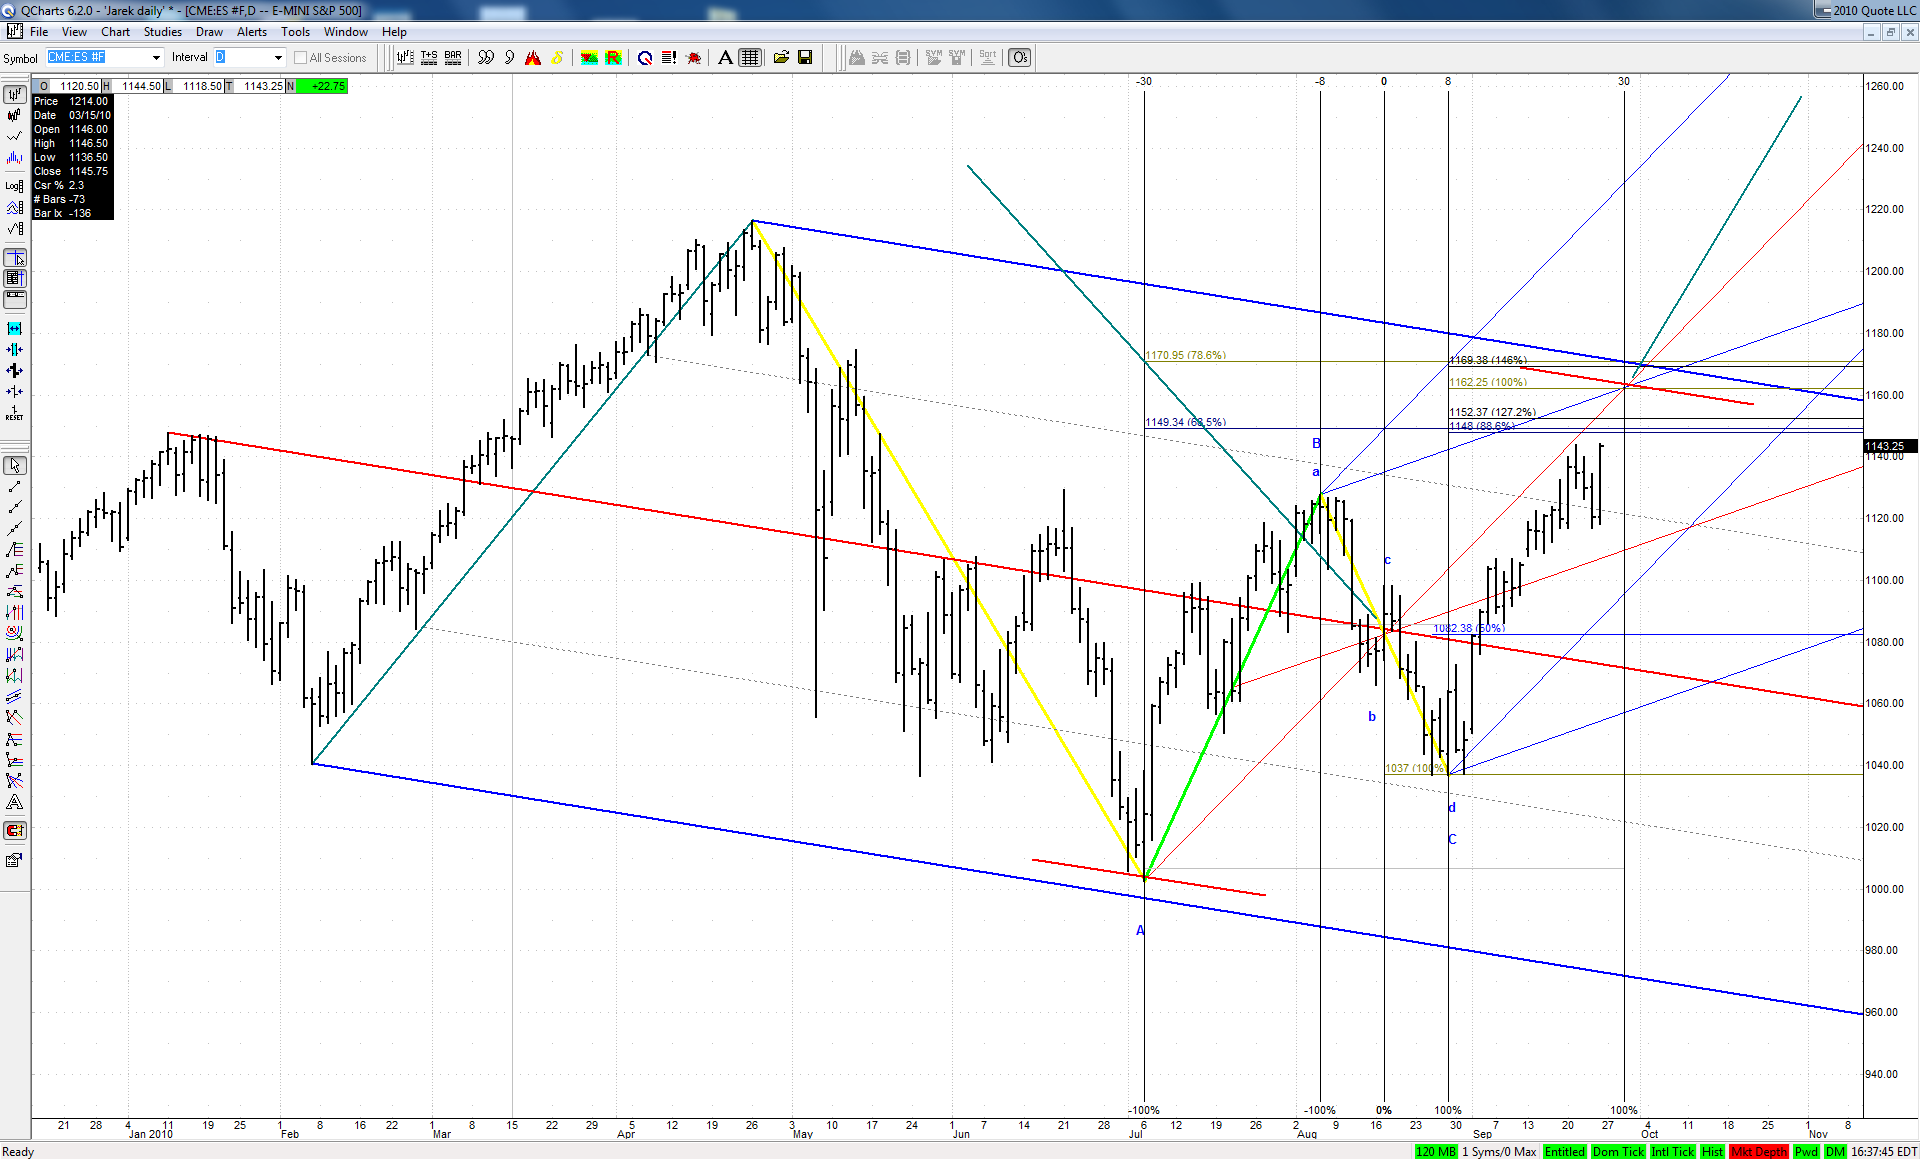
Here is an interesting story. While writing the topic above I was thinking about what chart to show this weekend. Then I noticed that the second date is a palindrome or in some way it is 'symmetrical'. Then I recalled Jim saying that sometimes ABCDs like to be symmetrical around certain point. Then I started digging and ended up with the following chart:
We may see that the BC leg of our current bearish ABCD, which was an ABCD itself was perfectly centered both in price and in time around its 'hub of the wheel' point on August 17th at around 1082 level.
To share the same characteristic the big ABCD should end on September 29th at around 1162 level. What's more interesting - this point is pretty well justified geometrically. Very curious.
JI
jimkane
Rep: 3,058
Posts: 33,089
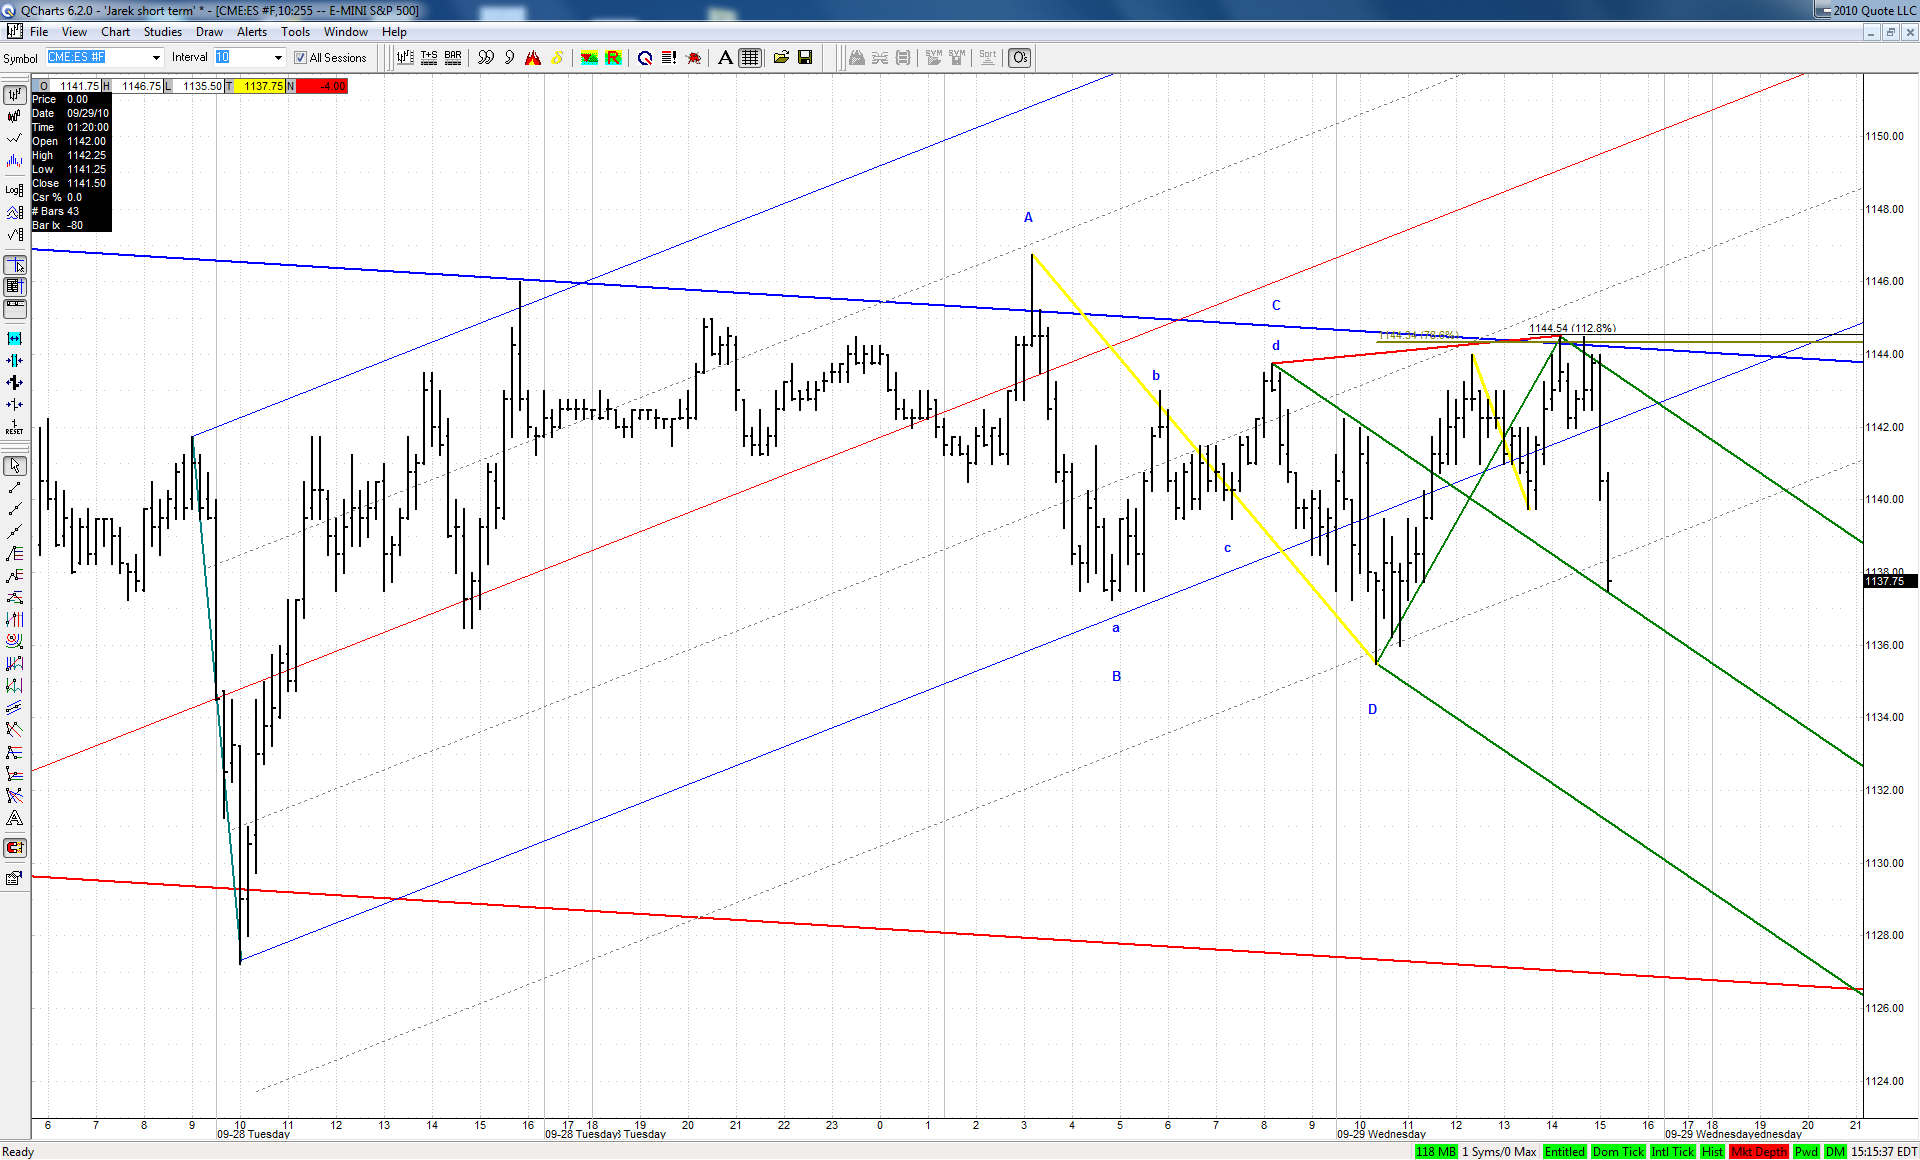
Well, sometimes they just do that, take endless shots at it, and then finally get it. I find it rare that they give up after so many tries and reverse, despite what some books and analysts say. But, as I write this, it is dropping sharply... A pullback for an assault from a lower point, or the exception to my experience???
JI
jimkane
Rep: 3,058
Posts: 33,089
Yep, looks like the green line is within range. Your blue line may hold and be a reversal point.
JI
jimkane
Rep: 3,058
Posts: 33,089
Okay, if they don't come in here, at a big convergence of lines, Fibs, etc., then this may be complete toast.
JI
jimkane
Rep: 3,058
Posts: 33,089
Originally posted by jimkane
1.272 hit. My best #'s are around 36.75-37.50.
Low was 37.00. 39.50 so far. But will it be working its way back to the HOD now, maybe in GLOBEX, or is this the start of something big to the downside, and that bounce was it?