MyPivots
Sign In
JA
jarek
Rep: 94
Posts: 3,474
Here is an interesting story. While writing the topic above I was thinking about what chart to show this weekend. Then I noticed that the second date is a palindrome or in some way it is 'symmetrical'. Then I recalled Jim saying that sometimes ABCDs like to be symmetrical around certain point. Then I started digging and ended up with the following chart:


Click image for original size
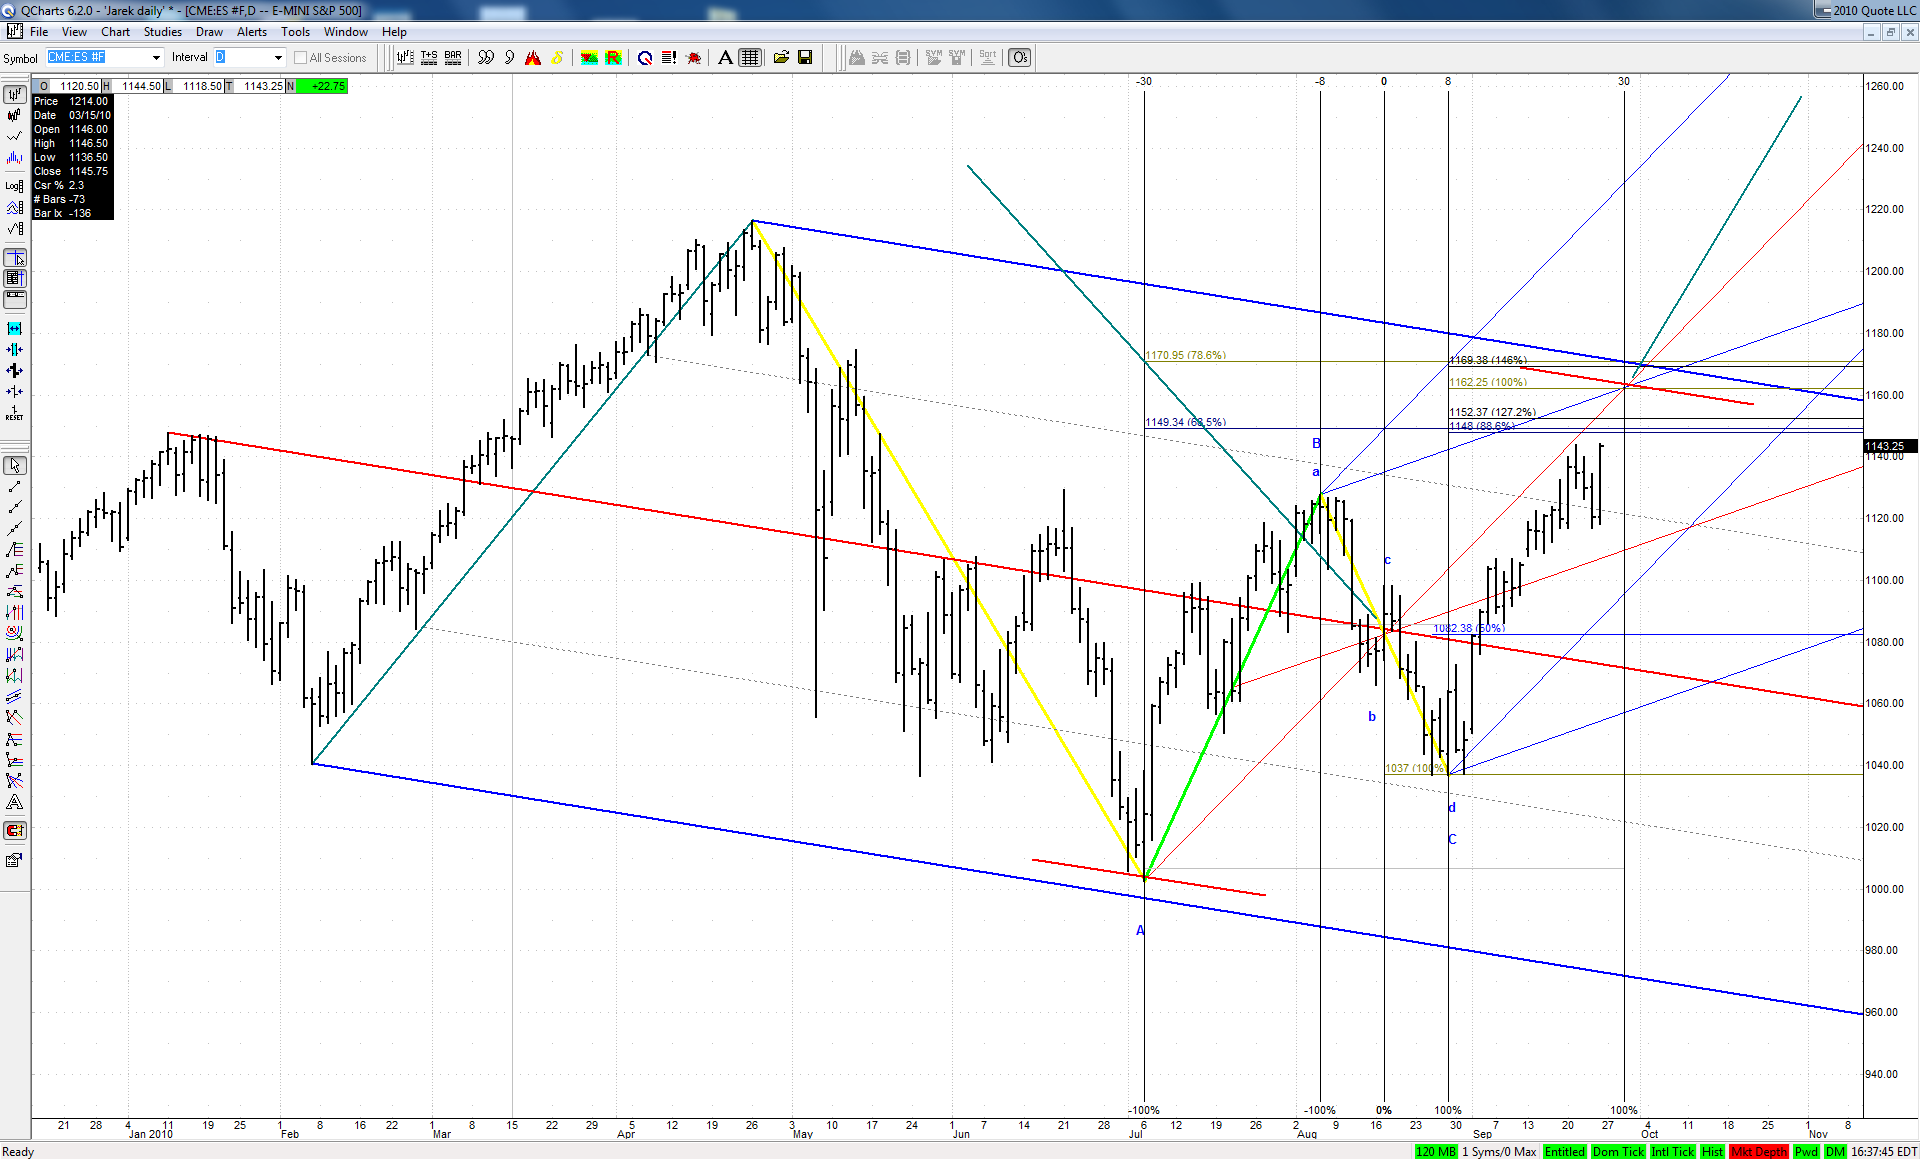


We may see that the BC leg of our current bearish ABCD, which was an ABCD itself was perfectly centered both in price and in time around its 'hub of the wheel' point on August 17th at around 1082 level.
To share the same characteristic the big ABCD should end on September 29th at around 1162 level. What's more interesting - this point is pretty well justified geometrically. Very curious.
JA
jarek
Rep: 94
Posts: 3,474
I'll be out for the remainder of the week and wish you all good trading!
JI
jimkane
Rep: 3,058
Posts: 33,089
Okay, have fun.
AL
albert
Rep: 99
Posts: 3,094
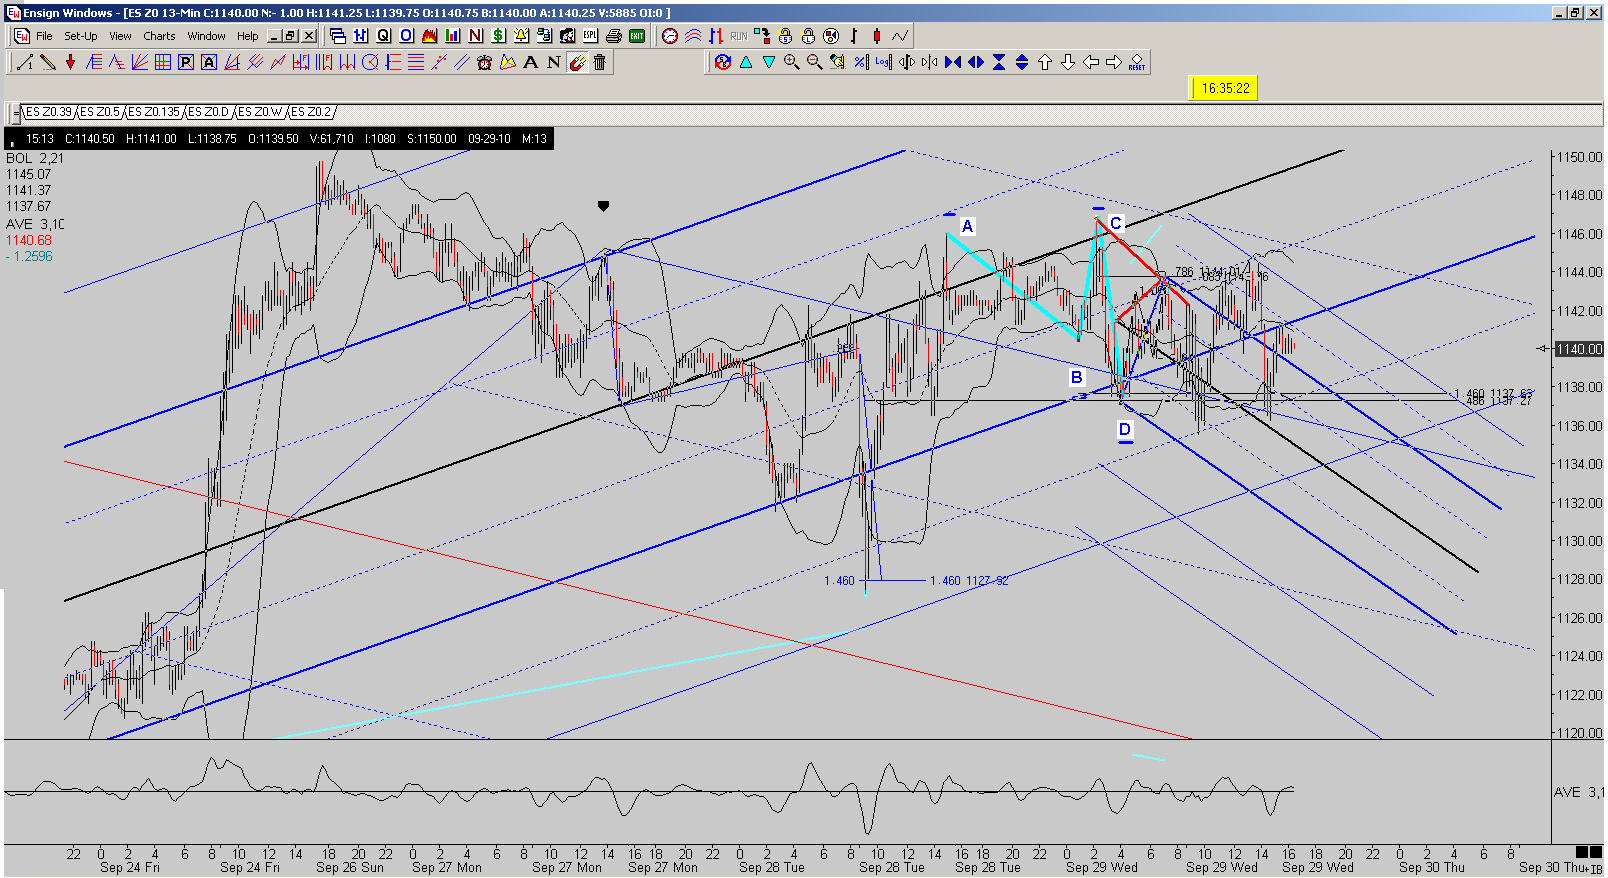
here is what I saw:

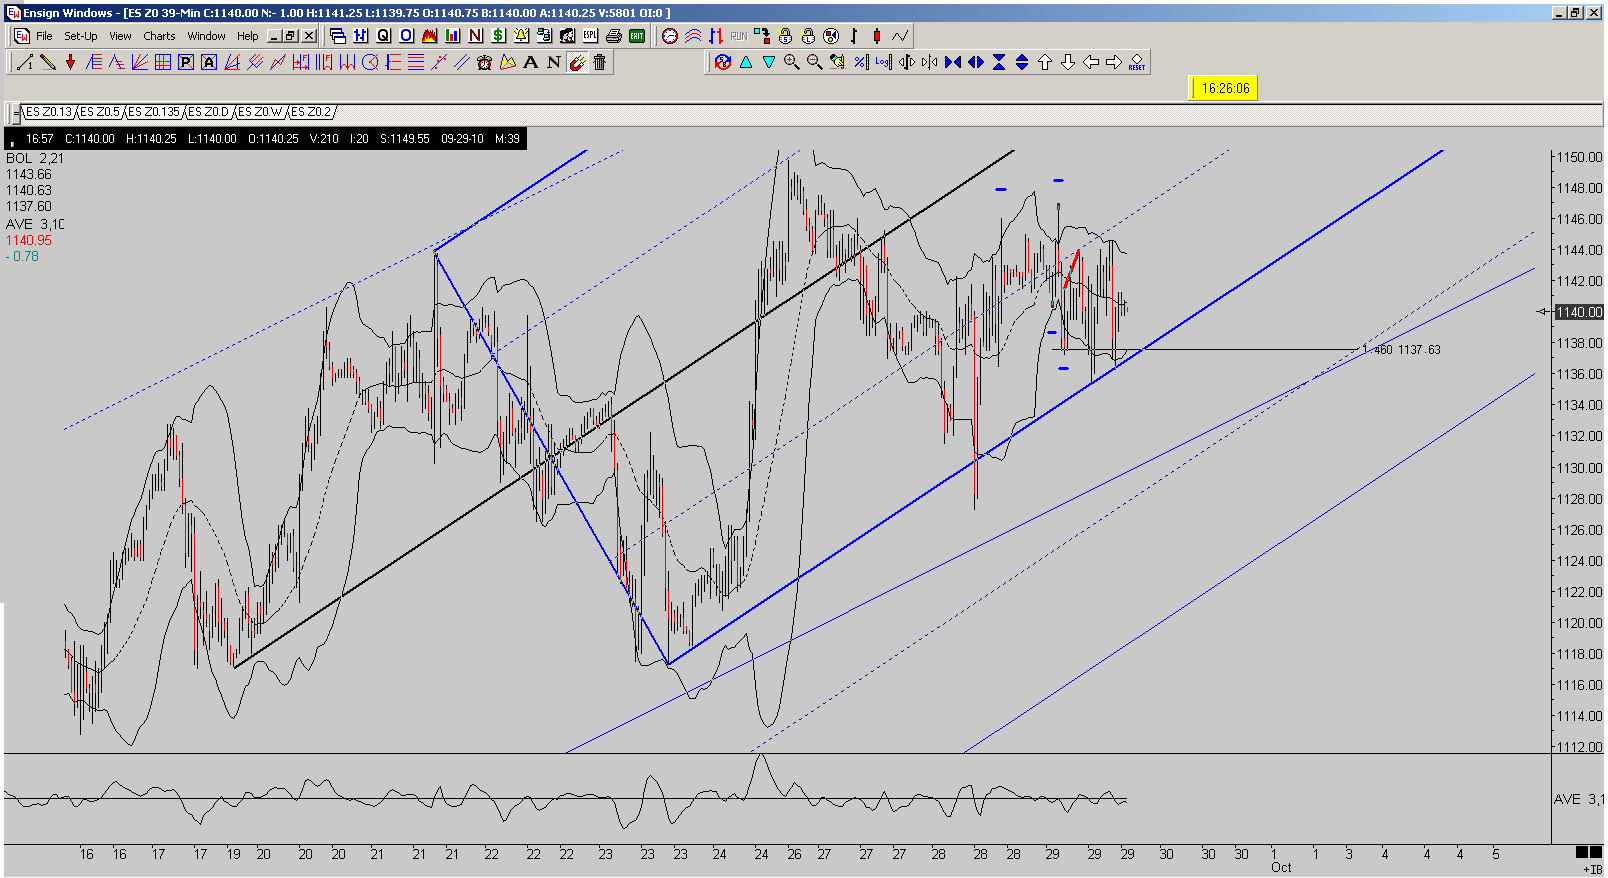
A Kane Double Top ABCD completing at 1.460 Fibo Retrace & 0.486 Fibo Retrace. From Point D, price rose in ABCD, reversing at 0.786 AB=CD, confluent with 3 D & 0.685 Fibo Retrace of GLOBEX Lo-to-Hi, with Divergence in 3-10 SMA Oscillator

Good Trading,

Al Kamego
Click image for original size

Click image for original size
AL
albert
Rep: 99
Posts: 3,094
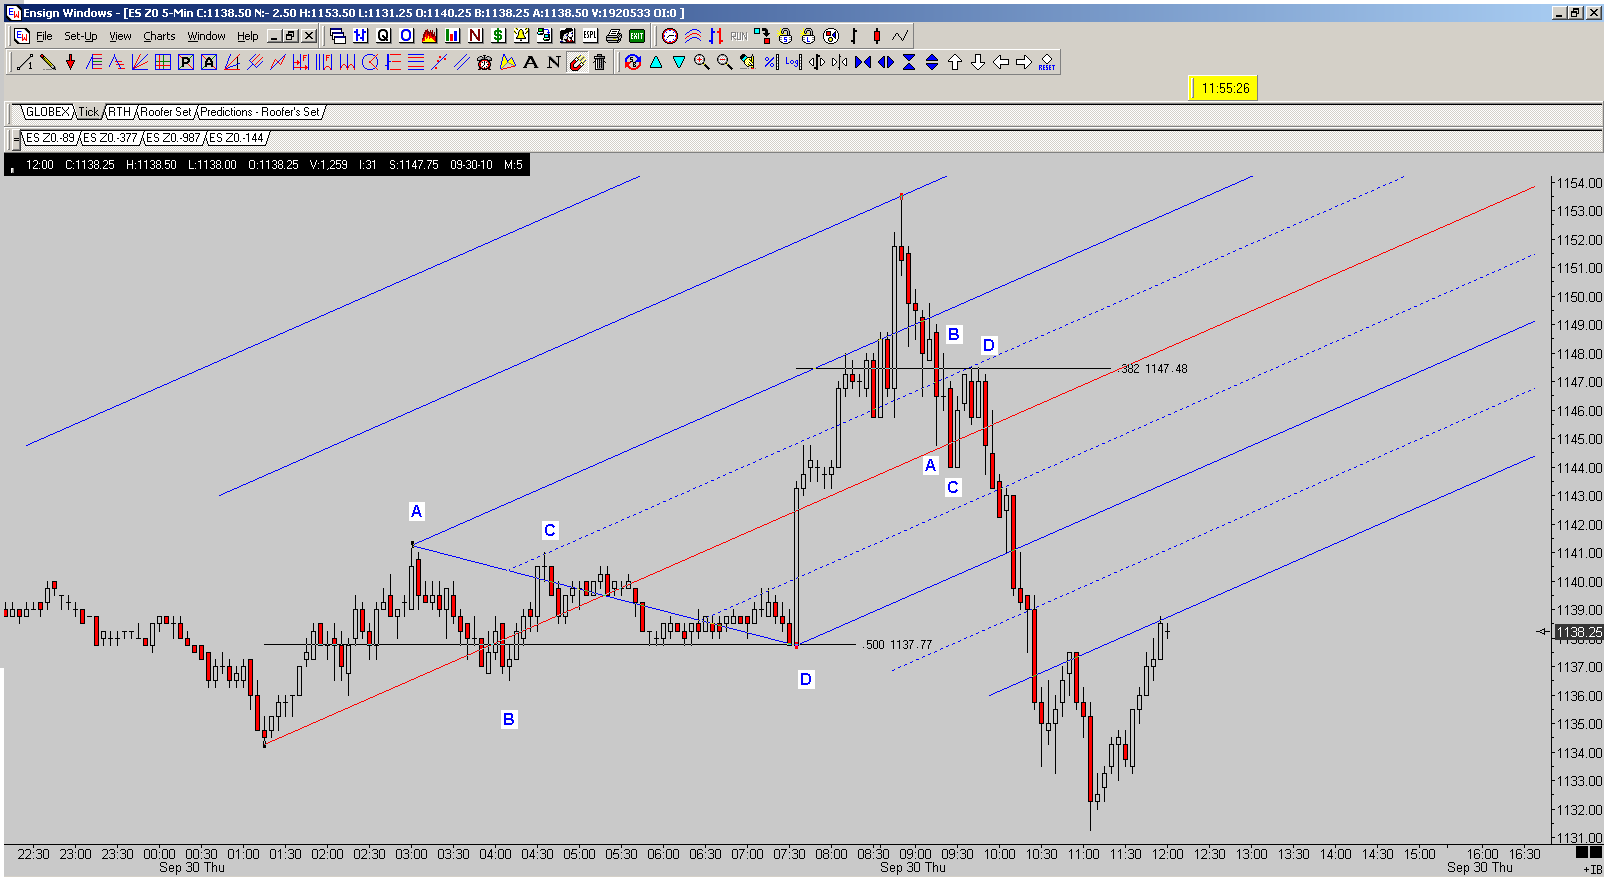
Kane 4 PCP completing at 0.500 & Kane TD ABCD completing at 0.383 Fibo Retrace.

Good Trading,

Al Kamego
Click image for original size
JI
jimkane
Rep: 3,058
Posts: 33,089
Okay, that was the best September since the Great Depression. I'm starting to think things are really improving in the economy, and we are really in pretty good shape after all. I think all that stuff on Zero Hedge is all wrong. I'm going back to CNBC and listening to the people that have it right.
RO
roofer
Rep: 3,689
Posts: 3,574
hahah!!!!!!that IS funny!
JI
jimkane
Rep: 3,058
Posts: 33,089
Thanks.
JA
jarek
Rep: 94
Posts: 3,474
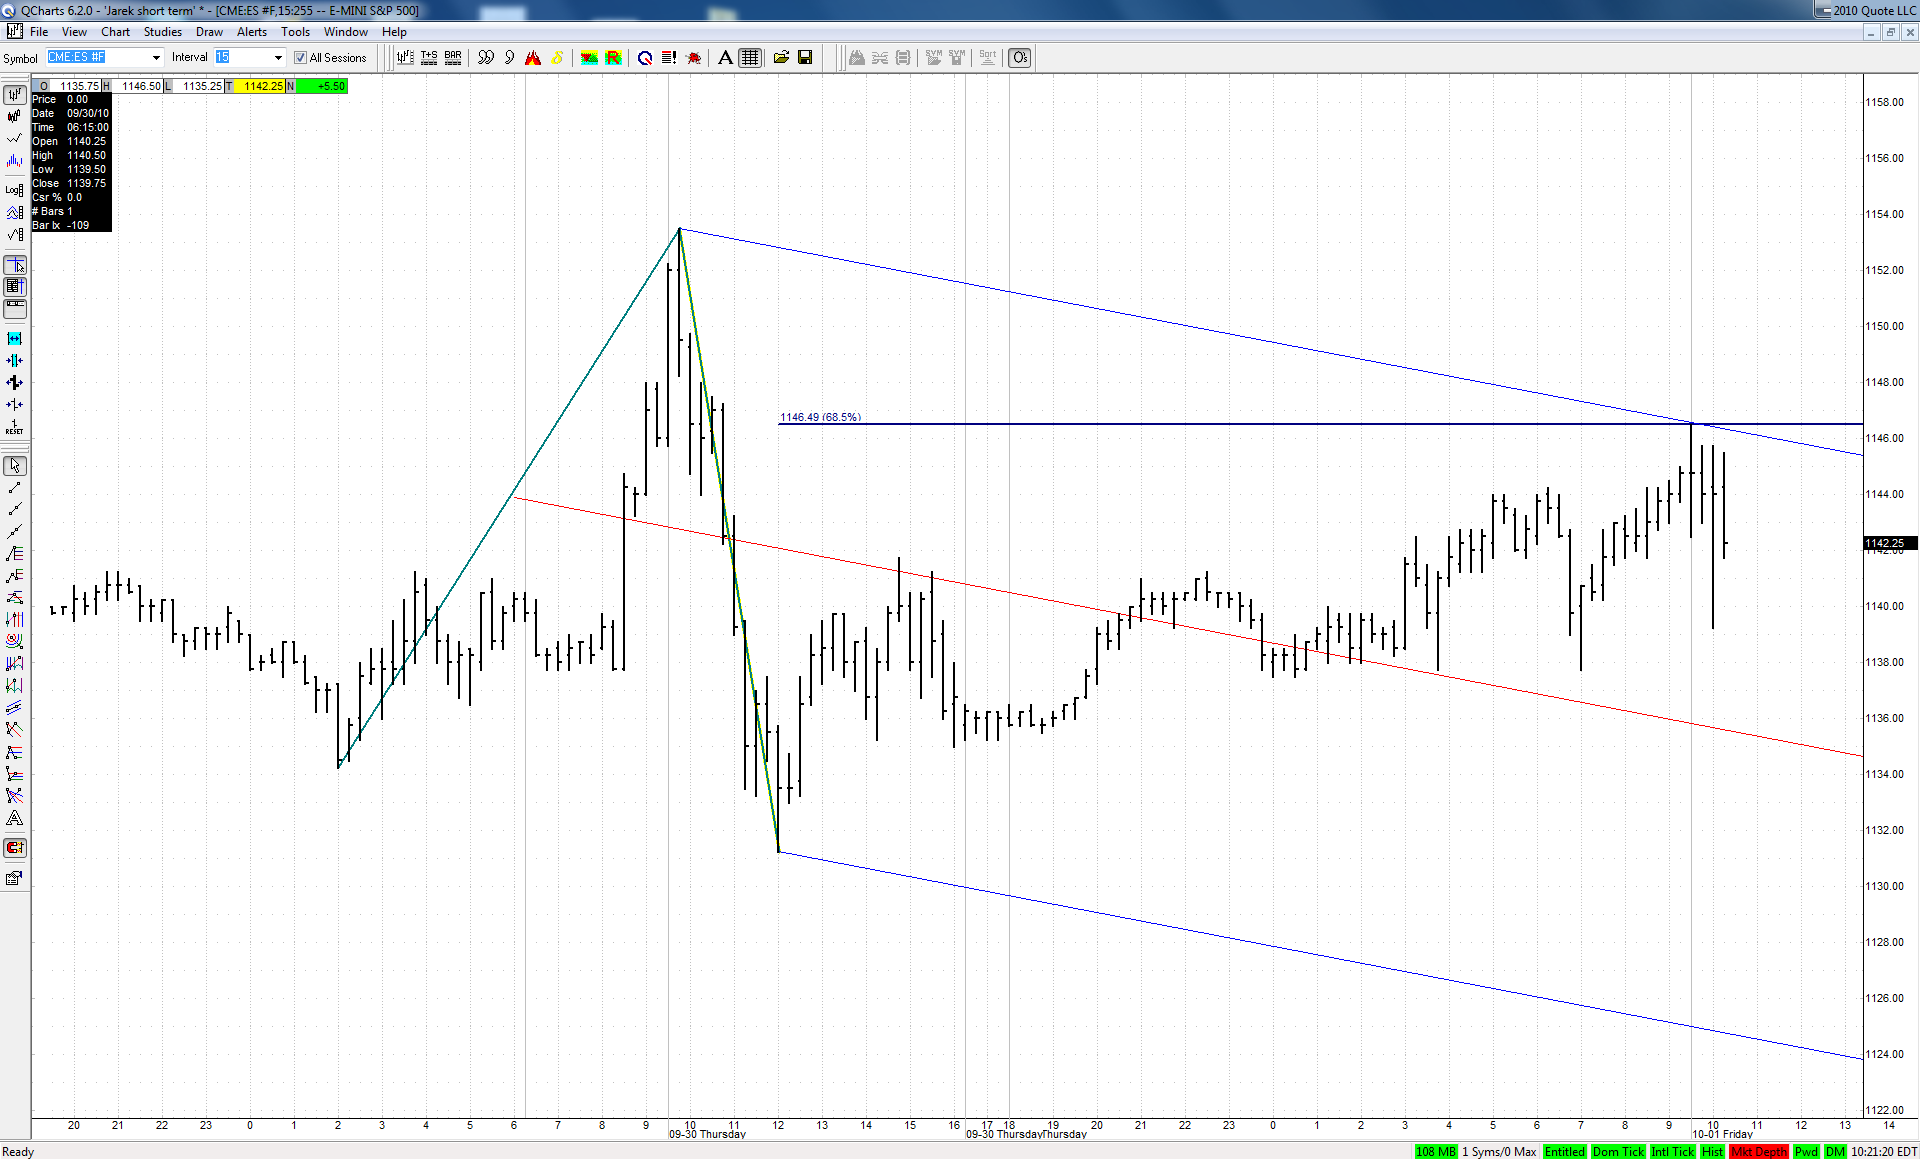
I came back earlier than expected and I see that on lower timeframes tools work better and better. For example this Shiff set in ES was hit to the tick:


Click image for original size


We may also observe higher volatitily in the last couple of days.
All this suggests that an important top should be nearby.
JA
jarek
Rep: 94
Posts: 3,474
There is bullish ABCD right at the ML of the Schiff set above. Bulls simply have to defend to stay in the game:


Click image for original size
JA
jarek
Rep: 94
Posts: 3,474
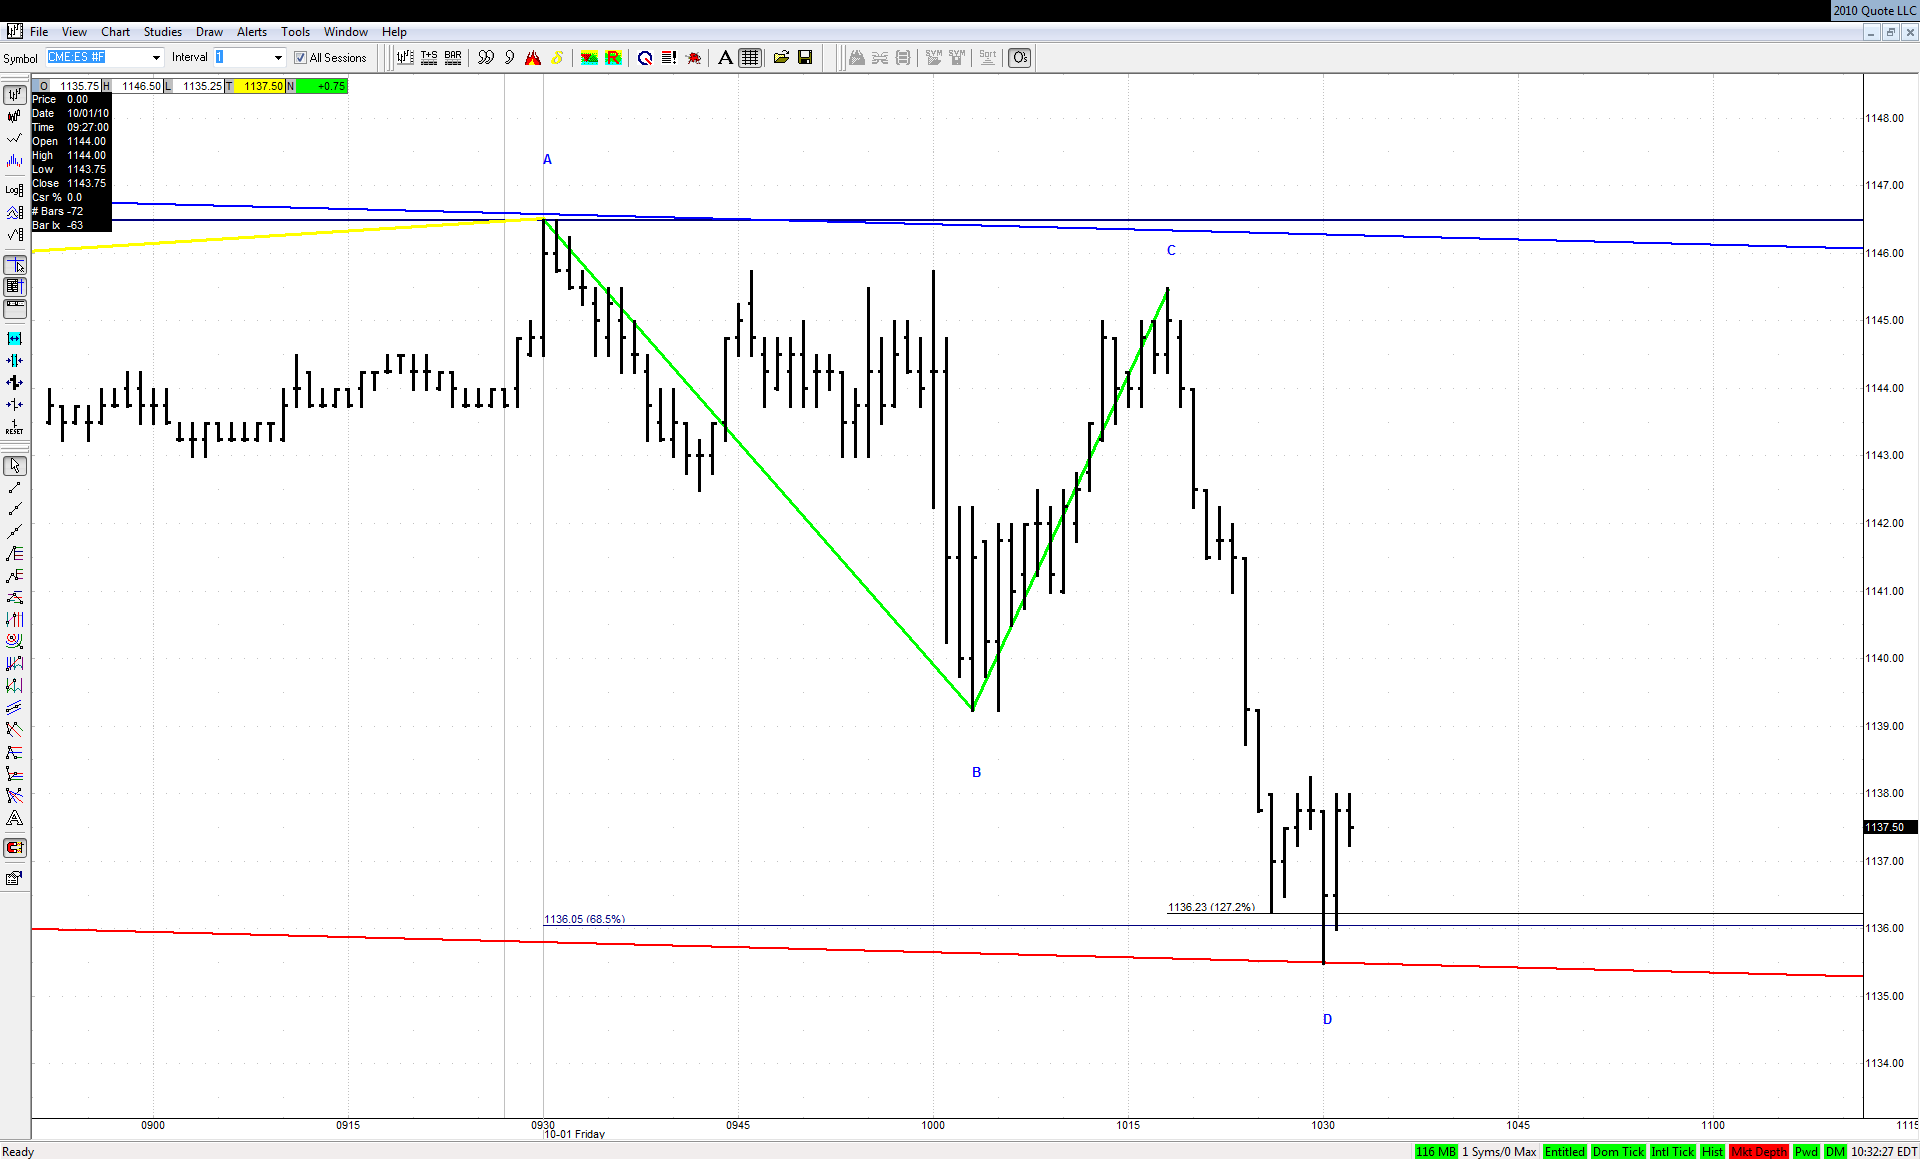
The ABCD breakout was a trap and bulls managed to stop the freefall with the help of 3D. But they still have a lot to prove today:


Click image for original size
JA
jarek
Rep: 94
Posts: 3,474
Thanks Jim. Have a good weekend!