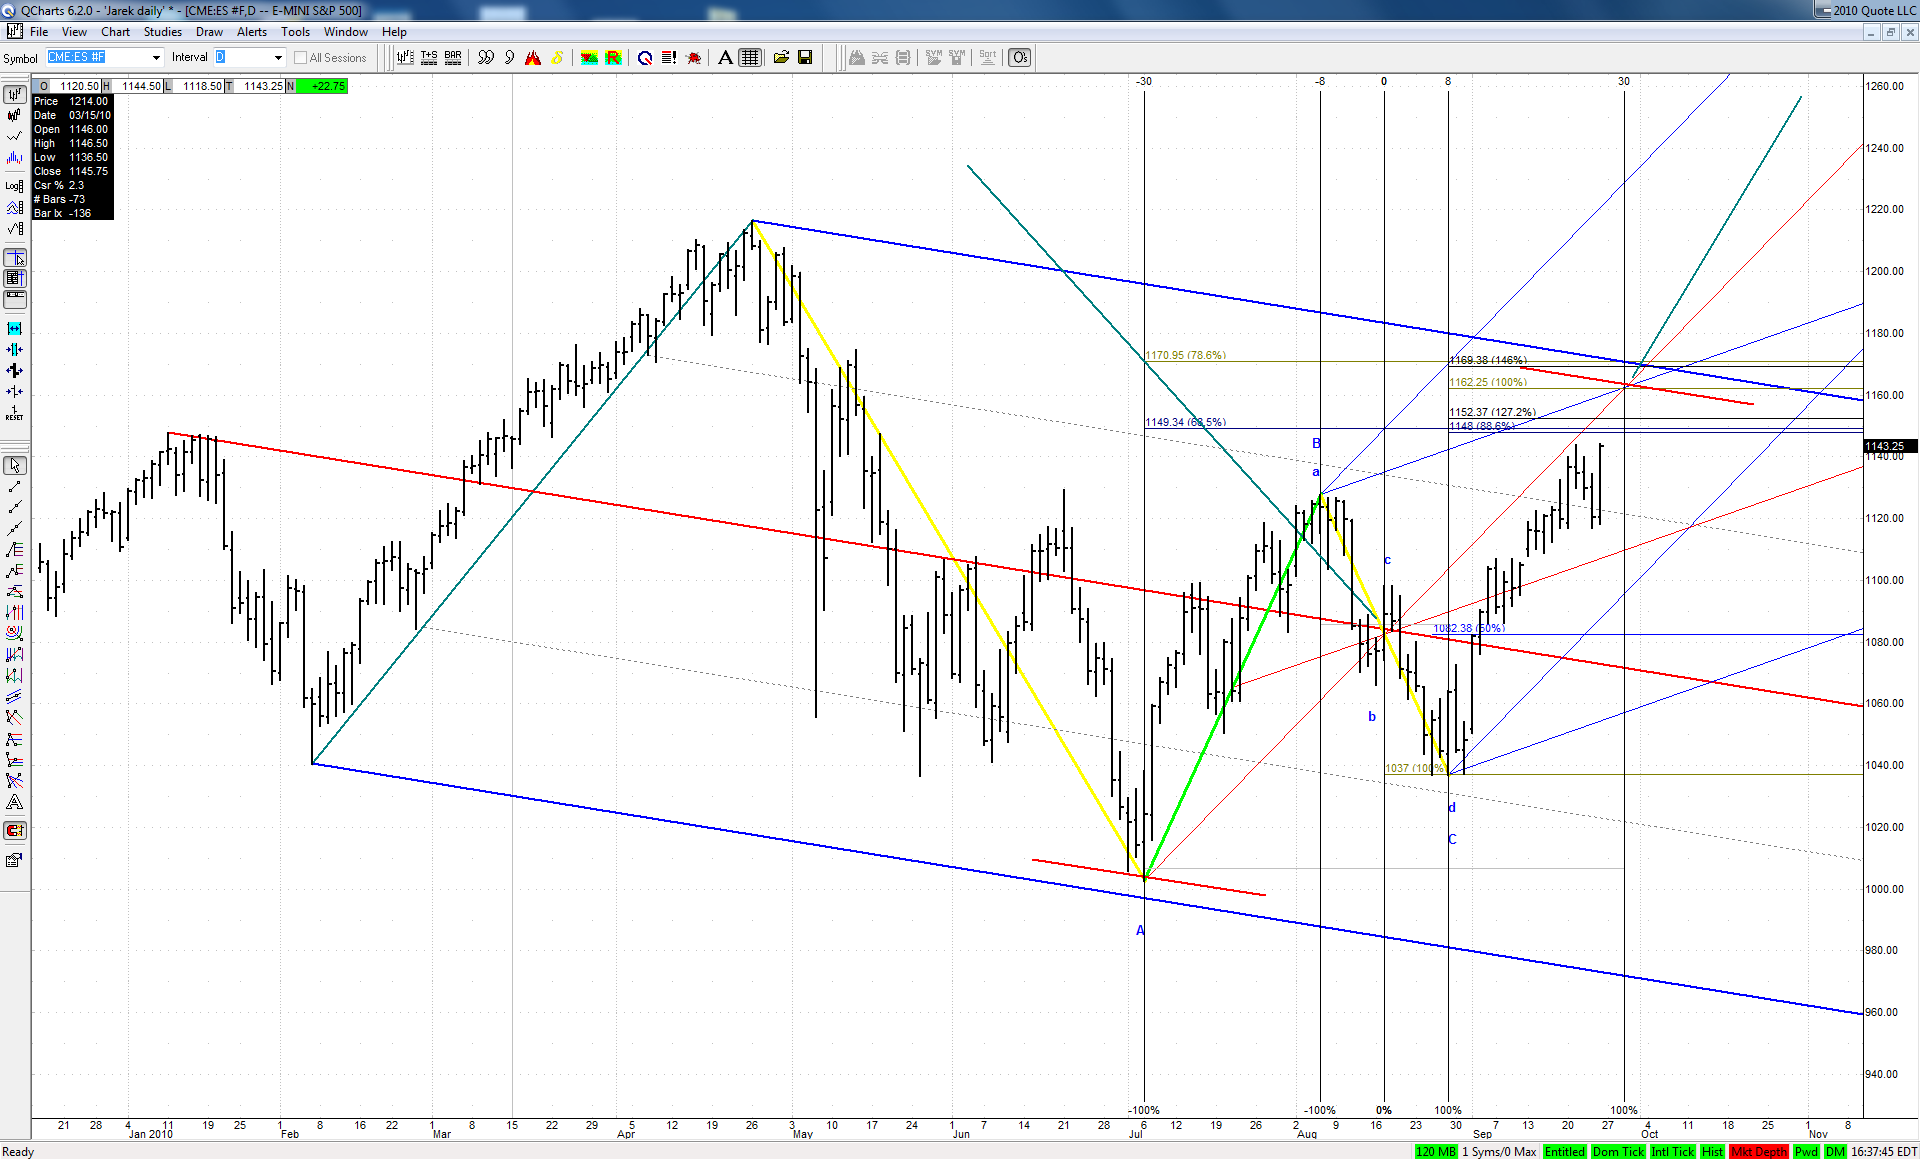
Here is an interesting story. While writing the topic above I was thinking about what chart to show this weekend. Then I noticed that the second date is a palindrome or in some way it is 'symmetrical'. Then I recalled Jim saying that sometimes ABCDs like to be symmetrical around certain point. Then I started digging and ended up with the following chart:
We may see that the BC leg of our current bearish ABCD, which was an ABCD itself was perfectly centered both in price and in time around its 'hub of the wheel' point on August 17th at around 1082 level.
To share the same characteristic the big ABCD should end on September 29th at around 1162 level. What's more interesting - this point is pretty well justified geometrically. Very curious.
JI
jimkane
Rep: 3,058
Posts: 33,089
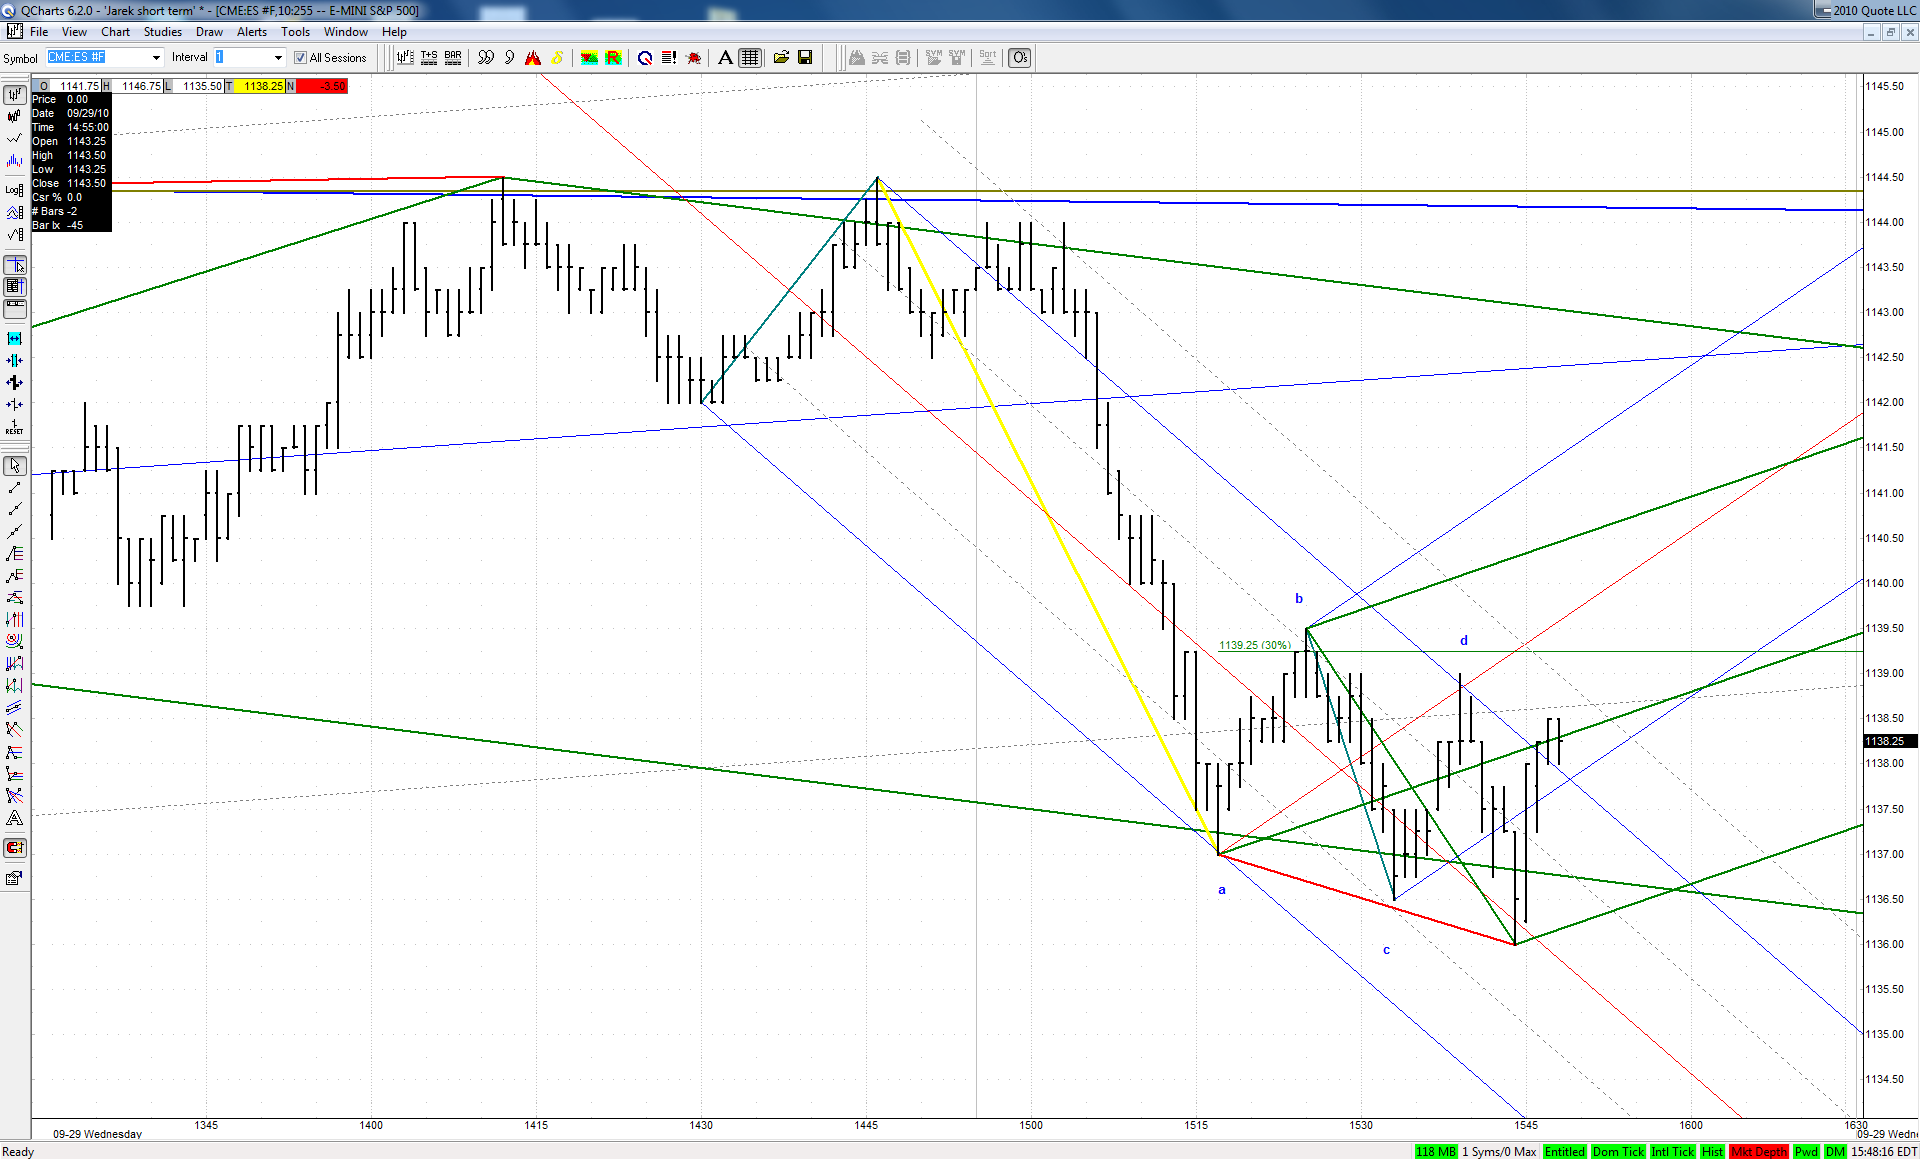
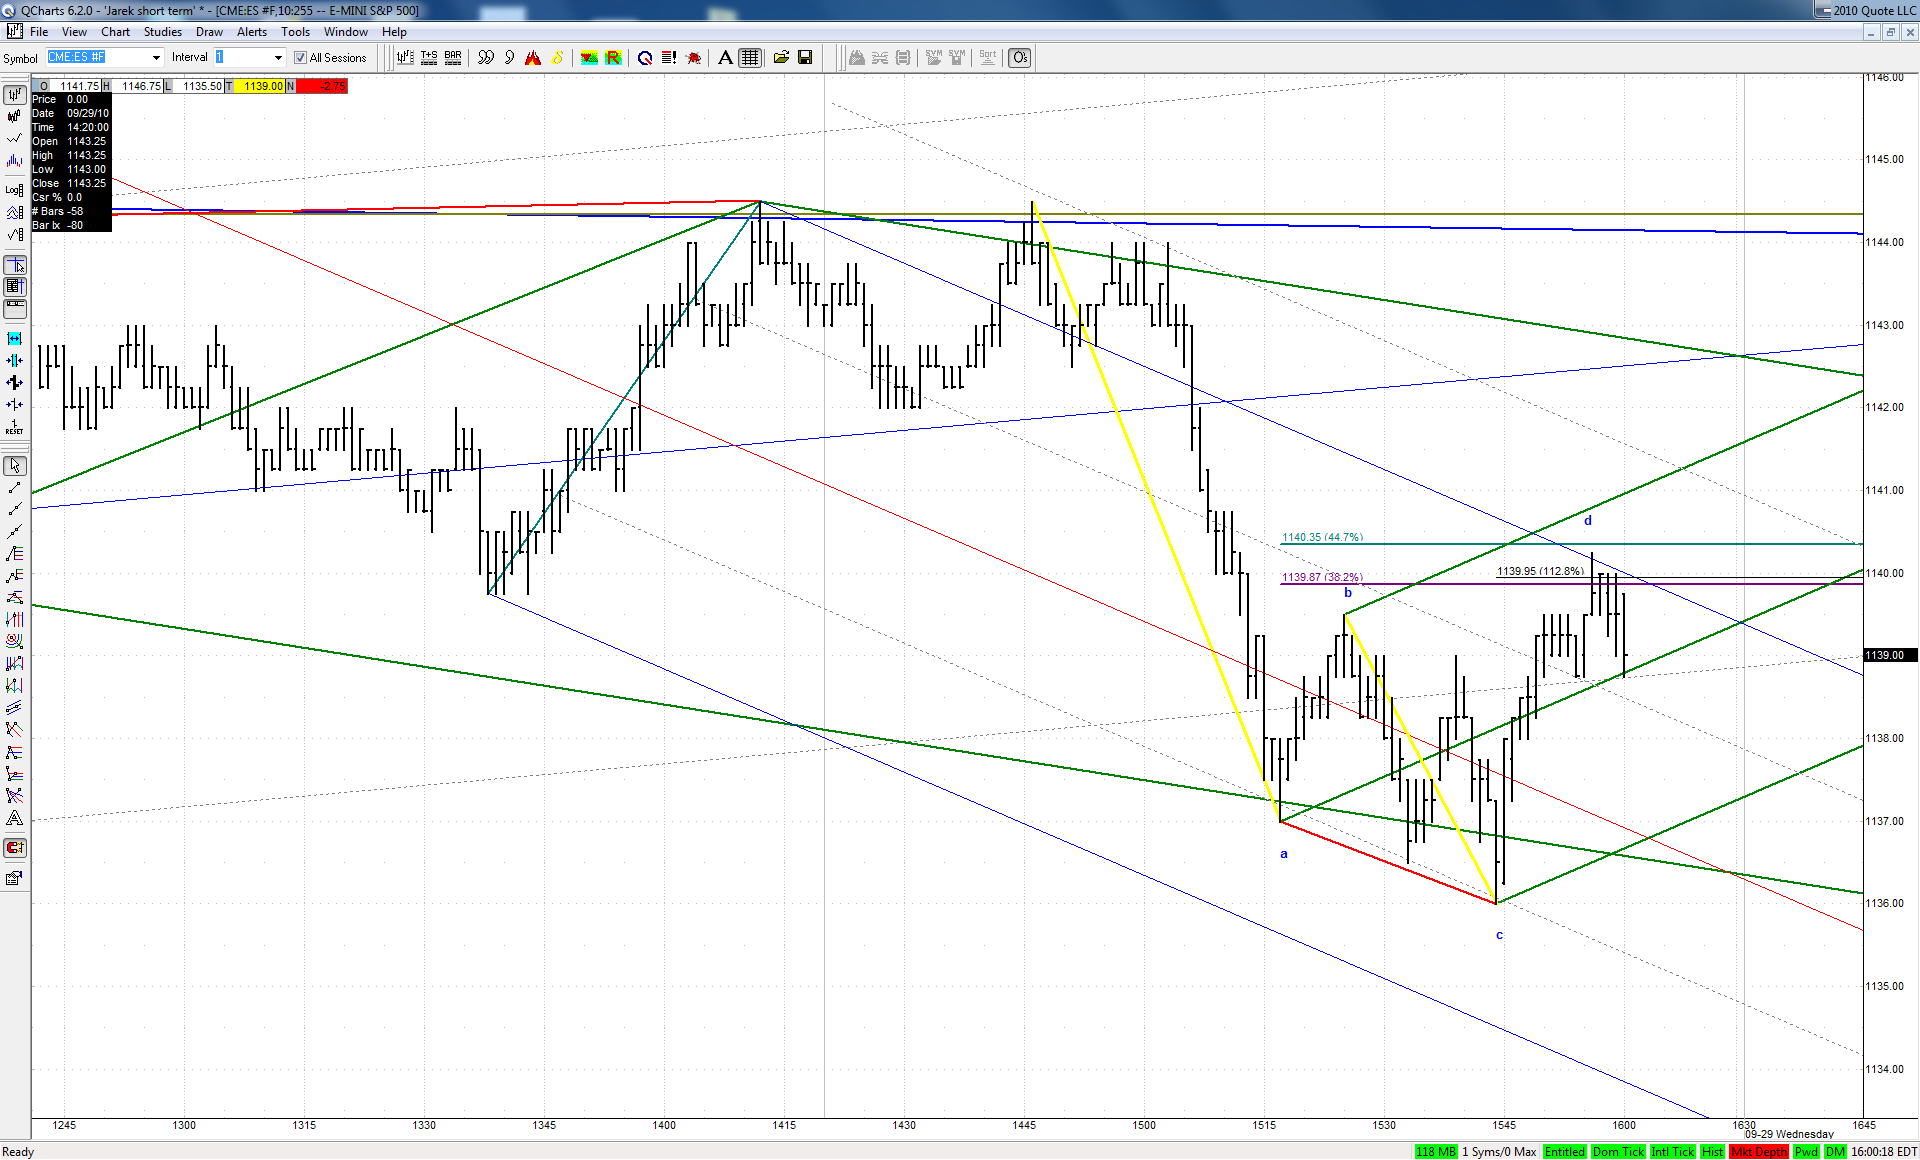
No one wants to get long after this little rollover move to a new low for the move, huh???
JI
jimkane
Rep: 3,058
Posts: 33,089
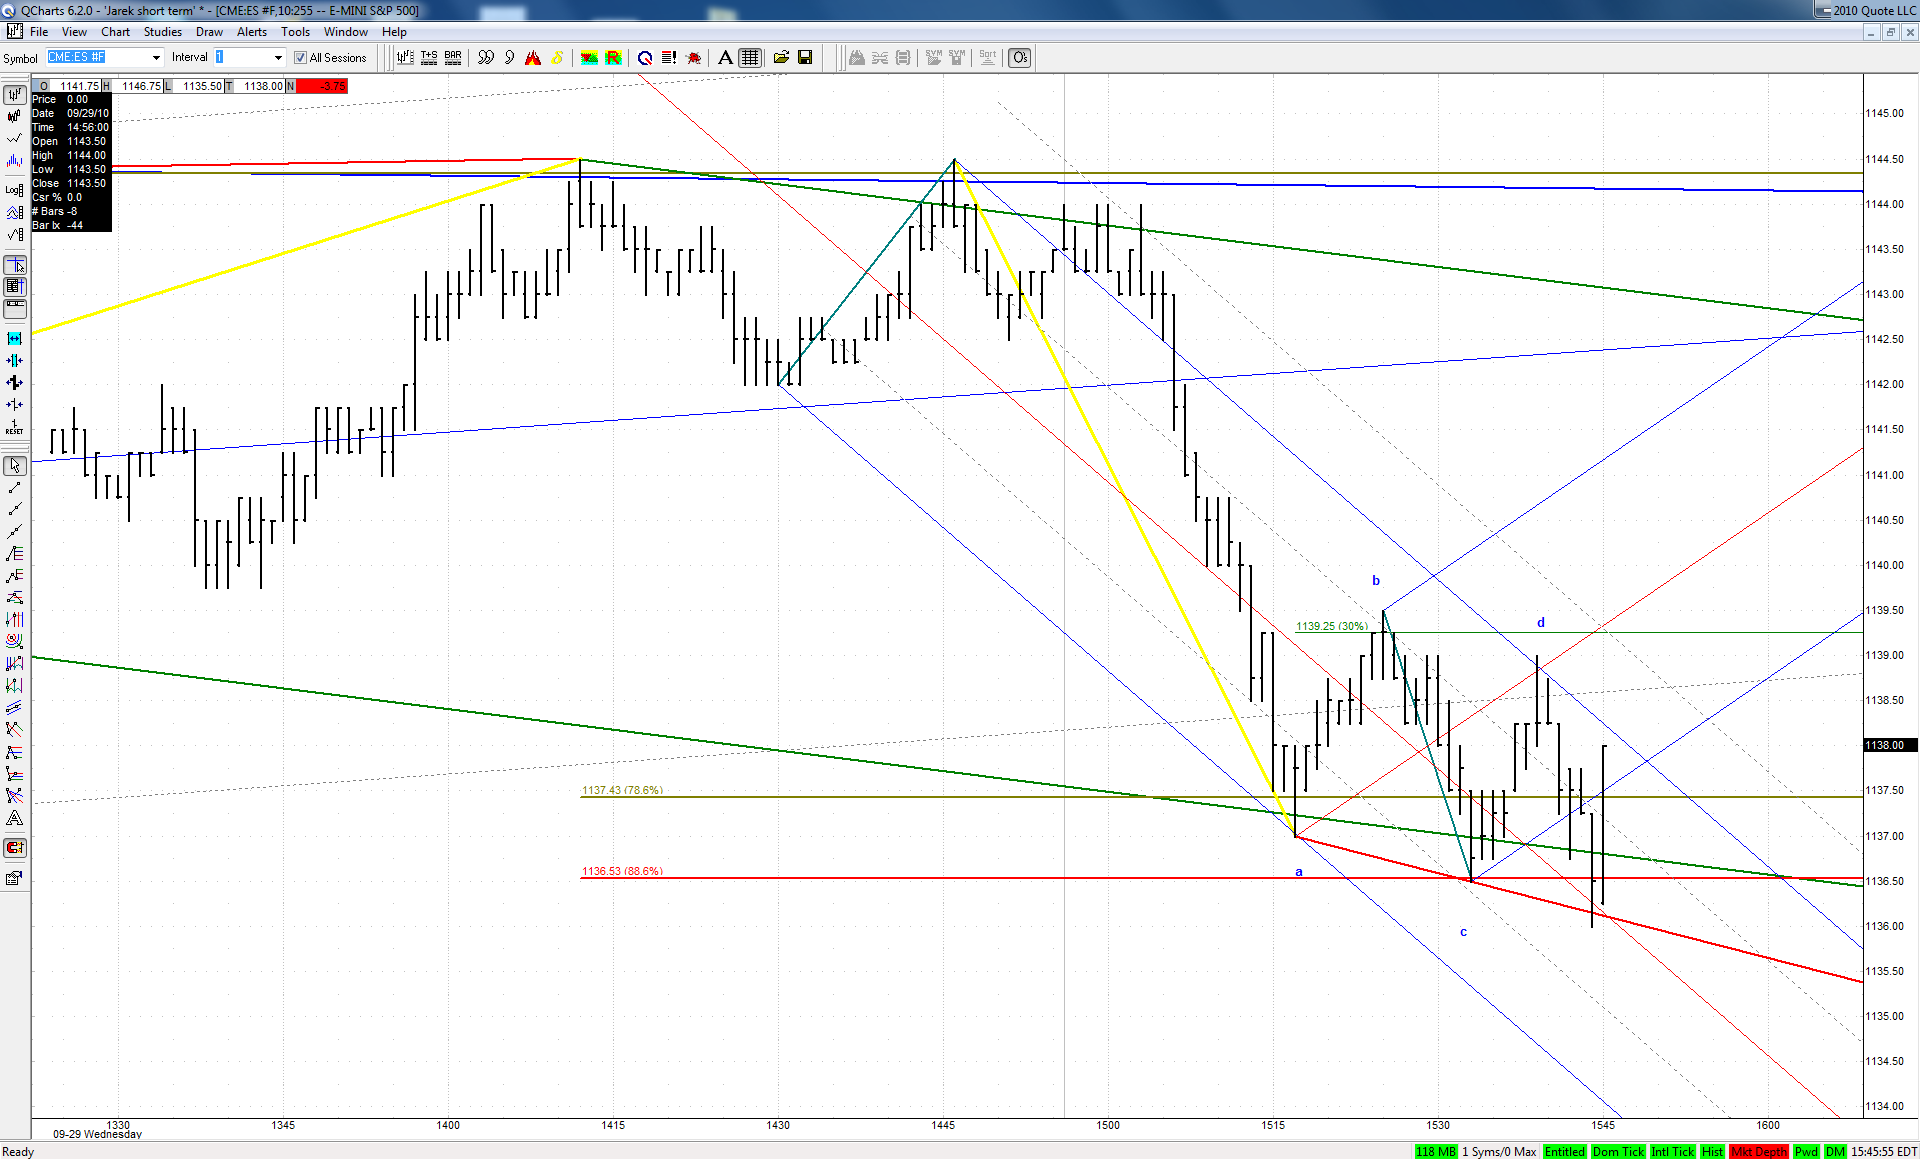
Now a 3D into the area. Still no long takers? Does everyone understand my reasoning behind this question?
JA
jarek
Rep: 94
Posts: 3,474
Originally posted by jimkane
...Does everyone understand my reasoning behind this question?
Why is that?
JI
jimkane
Rep: 3,058
Posts: 33,089
That's not the answer I was hoping for...
I have to leave shortly, so I will answer this tonight if I can. In the meantime, I hope a few people will take a shot at it.