Market Internals
I would like to start a thread on market internals, partly because I don't see much here about internals, and partly to get a sense of how other people are using internals, if at all.
Although I primarily trade ES using MP (no indicators), I watch order flow (contracts hitting the bid or lifting the offer) and internals to help me determine whether whether I want to be get long/short off a given MP level. My primary tools for trading besides MP: daily/Globex vol profile, composite(multi-day) MPs and composite vol profiles, MarketDelta Footprint and Time & Sales strips (both raw and filtered for size, and various internals.
The internals I watch:
$ADD
NYSE TICK (one of my favorites, I can't trade without it)
Cumulative NYSE TICK
VOLD
TRIN
VIX (not an internal per se, but I lump it in here anyways)
Major SPDR Sectors - XLV, XLB, XLE, XLI, XLF, XLU, XLK, XLP, XLY
SOX (Semis)
Dow Transports
New Highs/Lows
Plus a few others that I'd rather not talk about yet
I'll kick things off by saying that it is not uncommon for ES and internals to be divergent. And its also possible for internals to be divergent among themselves.
In my experience, when internals are diverging among themselves (not showing the same picture), it can be a clue that the day will be a rotational (bracketing/balancing/consolidating) day as opposed to a directional day (trend day). Attempting to identify as soon as possible whether the day is directional or rotational is one my main jobs as an ES daytrader.
Agree, disagree? Thoughts?
PopDoc
Originally posted by BruceM
Is this thread gonna go anywhere...? I'd hate to think it was just posted to get a "plug" in for the webinar....perhaps I'm just always so skeptical!
Sorry you think that Bruce. I've been a little busy on my end. But I have to say that it seems some people may have interpreted my post as a bit harsh...many people are looking for a formula, checklist, a system, a recipe for trading success. I'm trying my best to show people the reality of trading.
I will try to post a TICK chart at some point.
Originally posted by popdoc
Originally posted by BruceM
Is this thread gonna go anywhere...? I'd hate to think it was just posted to get a "plug" in for the webinar....perhaps I'm just always so skeptical!
Sorry you think that Bruce. I've been a little busy on my end. But I have to say that it seems some people may have interpreted my post as a bit harsh...many people are looking for a formula, checklist, a system, a recipe for trading success. I'm trying my best to show people the reality of trading.
Latest POMO schedule: http://www.newyorkfed.org/markets/tot_operation_schedule.html
I will try to post a TICK chart at some point.
Originally posted by popdoc
Originally posted by popdoc
Originally posted by BruceM
Is this thread gonna go anywhere...? I'd hate to think it was just posted to get a "plug" in for the webinar....perhaps I'm just always so skeptical!
Sorry you think that Bruce. I've been a little busy on my end. But I have to say that it seems some people may have interpreted my post as a bit harsh...many people are looking for a formula, checklist, a system, a recipe for trading success. I'm trying my best to show people the reality of trading.
Latest POMO schedule: http://www.newyorkfed.org/markets/tot_operation_schedule.html
I will try to post a TICK chart at some point.
TICK just hit -1500 a few minutes ago....the lowest level i think i've ever seen. the key is to watch it now to see if it stays mostly below zero line or not. IMO.
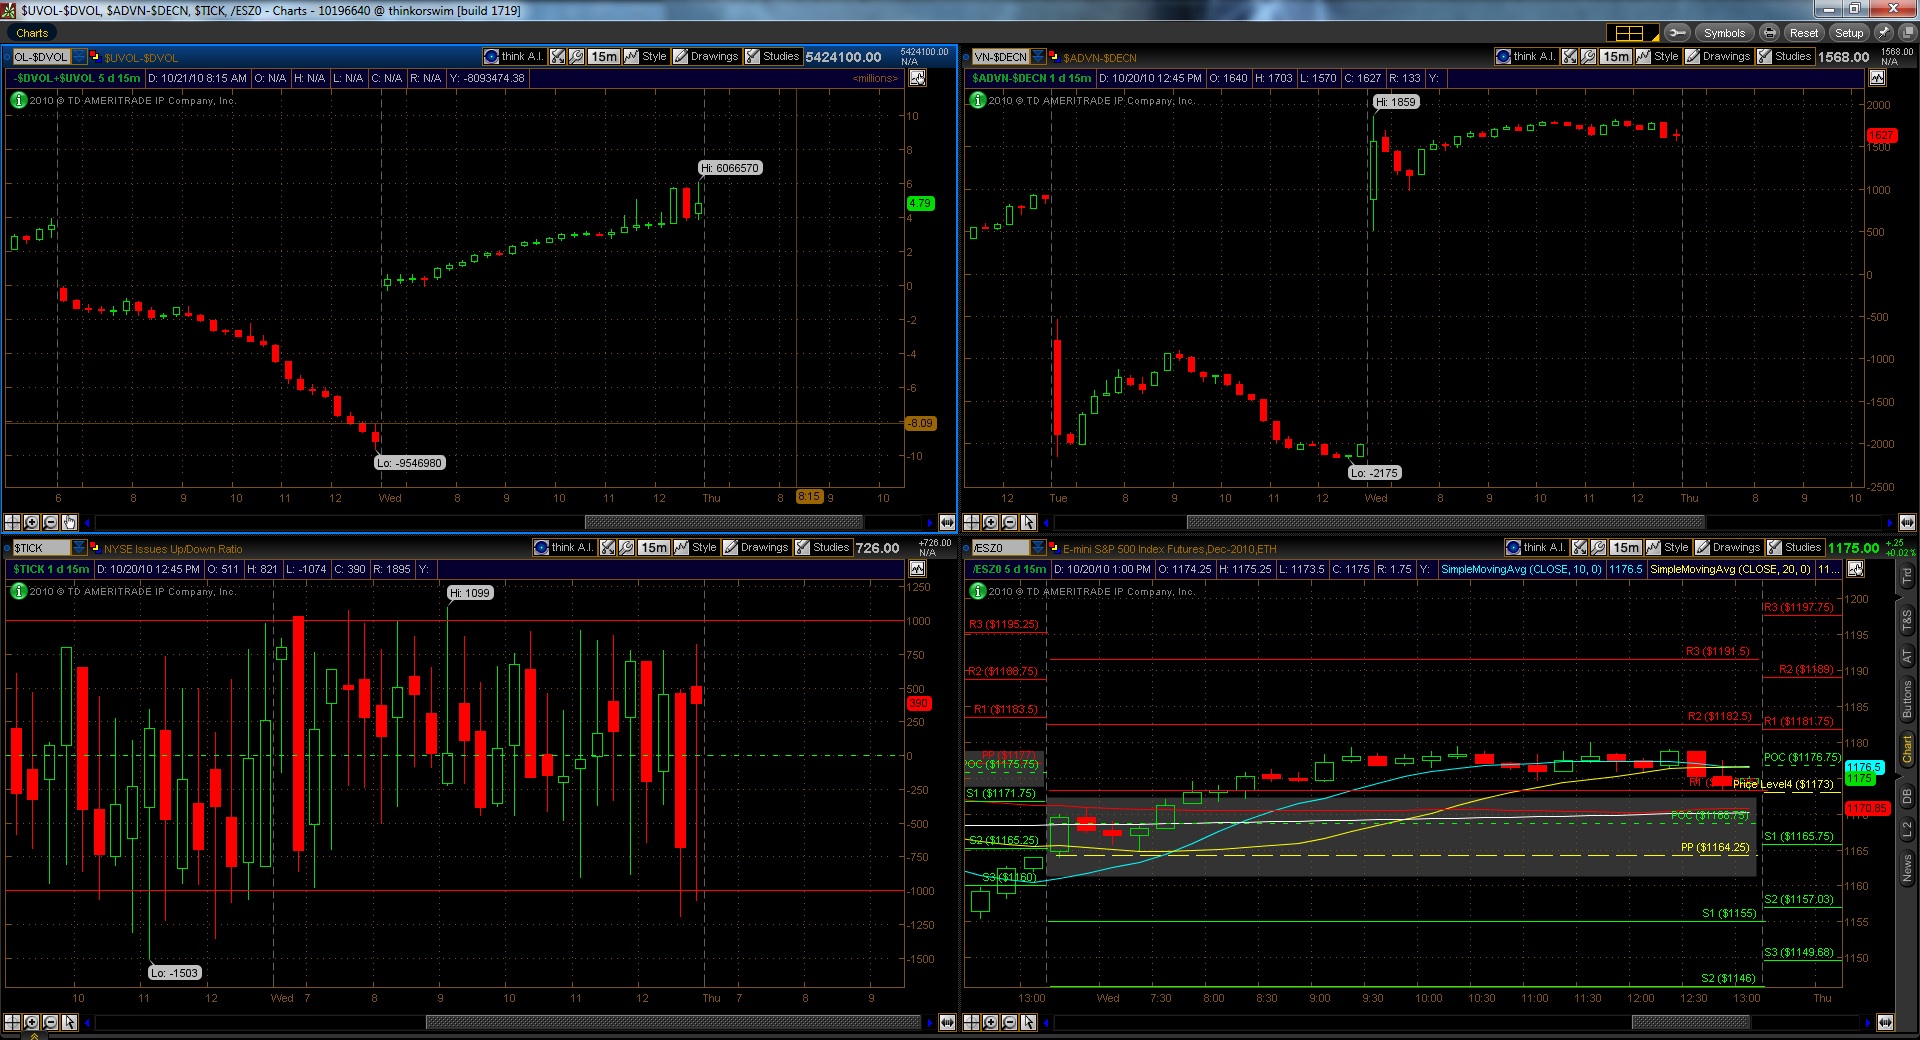
There is a chart system that is promoted by the folks on one of the chat rooms on the TOS platform. While I don't listen to the chat much, the system of watching market internals seems to work fine. I think you can set it up on their free paper money side. The paper money is very close (within a couple of seconds) to the live site. Here is the system these guys use.
Set up a quad chart screen from the menu bar. Set style of all charts to 2day 15 minute bars.
Upper left chart is $UVOL-$DVOL. This gives a result of the difference between up volume and down volume on the NYSE. For COMP just add a Q on the end ($UVOLQ-$DVOLQ). You can watch as selling or buying pressure increases or decreases or see if the market is trending sideways..
Upper right is $ADVN-$DECN which is advancing the result of advancing issues minus declining issues.
Lower left is $tick which is a very short term indicator. Spikes over 1000 are usually met with an opposite reaction on the same or next bar. Candle bodies above or below the zero line are telling you whether buyers or sellers are in play.
Lower right you can set up an ES chart and manually enter your pivots or market profile price levels.
You can also go the the "Market Watch" page and set up your own breadth chart using your favorite indexes or etf's. It will give you a very nice bar chart side-by-side comparison of the different sectors.
Looks like the PPT is at work on ES so got to go now.
Here is what it would look like on the TOS platform. I believe you can do this on a free paper trading account
Click image for original size
Emini Day Trading /
Daily Notes /
Forecast /
Economic Events /
Search /
Terms and Conditions /
Disclaimer /
Books /
Online Books /
Site Map /
Contact /
Privacy Policy /
Links /
About /
Day Trading Forum /
Investment Calculators /
Pivot Point Calculator /
Market Profile Generator /
Fibonacci Calculator /
Mailing List /
Advertise Here /
Articles /
Financial Terms /
Brokers /
Software /
Holidays /
Stock Split Calendar /
Mortgage Calculator /
Donate
Copyright © 2004-2023, MyPivots. All rights reserved.
Copyright © 2004-2023, MyPivots. All rights reserved.