shorts on 12-5-10
have begun for me ...3 points above fridays close here in sunday O/N session.... RTH range was inside the O/N on Friday.....will add at 28 even and 32.50 if needed
In my opinion all prices above 1187 are great shorts.
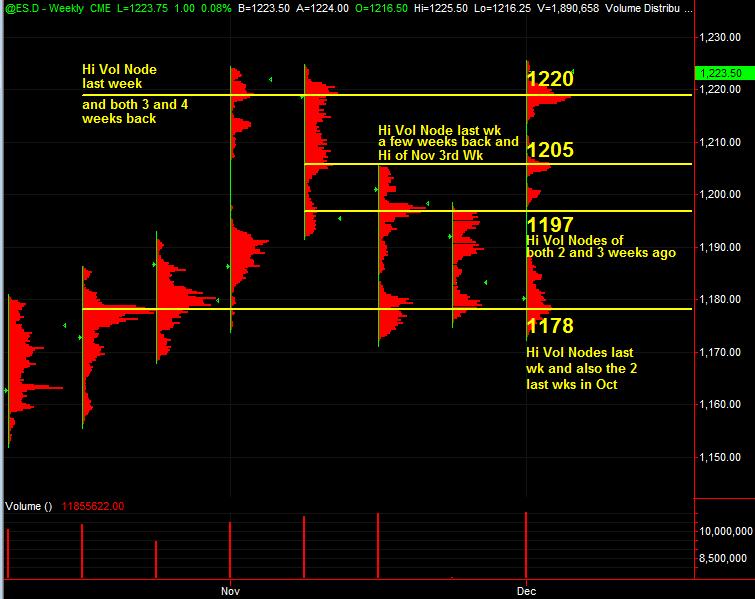
Just thought I'd toss in a Weekly (RTH) chart from TradeStation of Volume at Price ... pointing out HVN areas ... but other areas of activity (or lack thereof) can also be seen showing both high and low volume areas for consideration.
Click image for original size
btw ... got a lotta stuff indicative of an overbot point coming into Monday (and no reports or economic releases). Referring to bull/bear sentiment indicators as well as short and long term variety of "oscillator" type indicators which I'm typically not a big fan of ... and also Market Internals showing an overbought extreme as well.
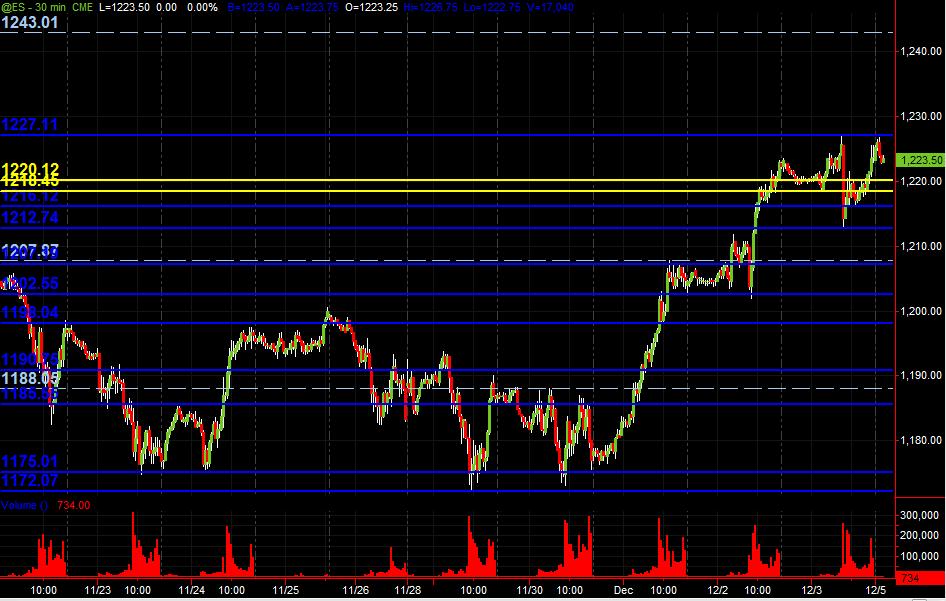
I'll post my PASR chart, but am not totally comfortable with it and have no real prices above the current market price where I've got decent resistance levels.
Blue lines are potential signif PASR levels ... Whitish Dashed lines are Wkly Pvt levels ... and have 2 Yellow lines (just for me I guess) that are HVN Wkly Volume at Price areas I wanted on my chart. This is just my MAP coming into the week. Hope it's helpful to any and all.
I'll post my PASR chart, but am not totally comfortable with it and have no real prices above the current market price where I've got decent resistance levels.
Click image for original size
Blue lines are potential signif PASR levels ... Whitish Dashed lines are Wkly Pvt levels ... and have 2 Yellow lines (just for me I guess) that are HVN Wkly Volume at Price areas I wanted on my chart. This is just my MAP coming into the week. Hope it's helpful to any and all.
btw ... nice to have you back and posting AK1 ... seriously
closed this out at 21.50..firday breakout point.......we also had a plus 1000 or more closing $Tick on Friday..so that is one more thing for the overbought camp...
a poor low on Friday...that hourly low that had three 30 minute bars at the same price.....
a poor low on Friday...that hourly low that had three 30 minute bars at the same price.....
Now have current O/N low at 16.25 which matches up EXACTLY with the "Poor" low from Fridays RTH..(so a big ledge of prices)...market is up at 21 area again...another key area....
As MM said there are no reports so reversion trading will be best....for me it will be selling the rallies in RTH and trying to find a good short NOW again in O/N to try and run out that 16.25...we know lots of stops are down there
Key numbers today:
25.50 **** so far they don't like this RAT!!
21
16 - 17
12.50*****
that would be considered a spike on friday....with the low of that spike at 20.75....so us MP traders will be watching where we open in relation to that spike in the RTH......let me write spike a few more times while I'm still waking up......
the point is that it is a spike.....so be careful inside of it if we come back into it..
the point is that it is a spike.....so be careful inside of it if we come back into it..
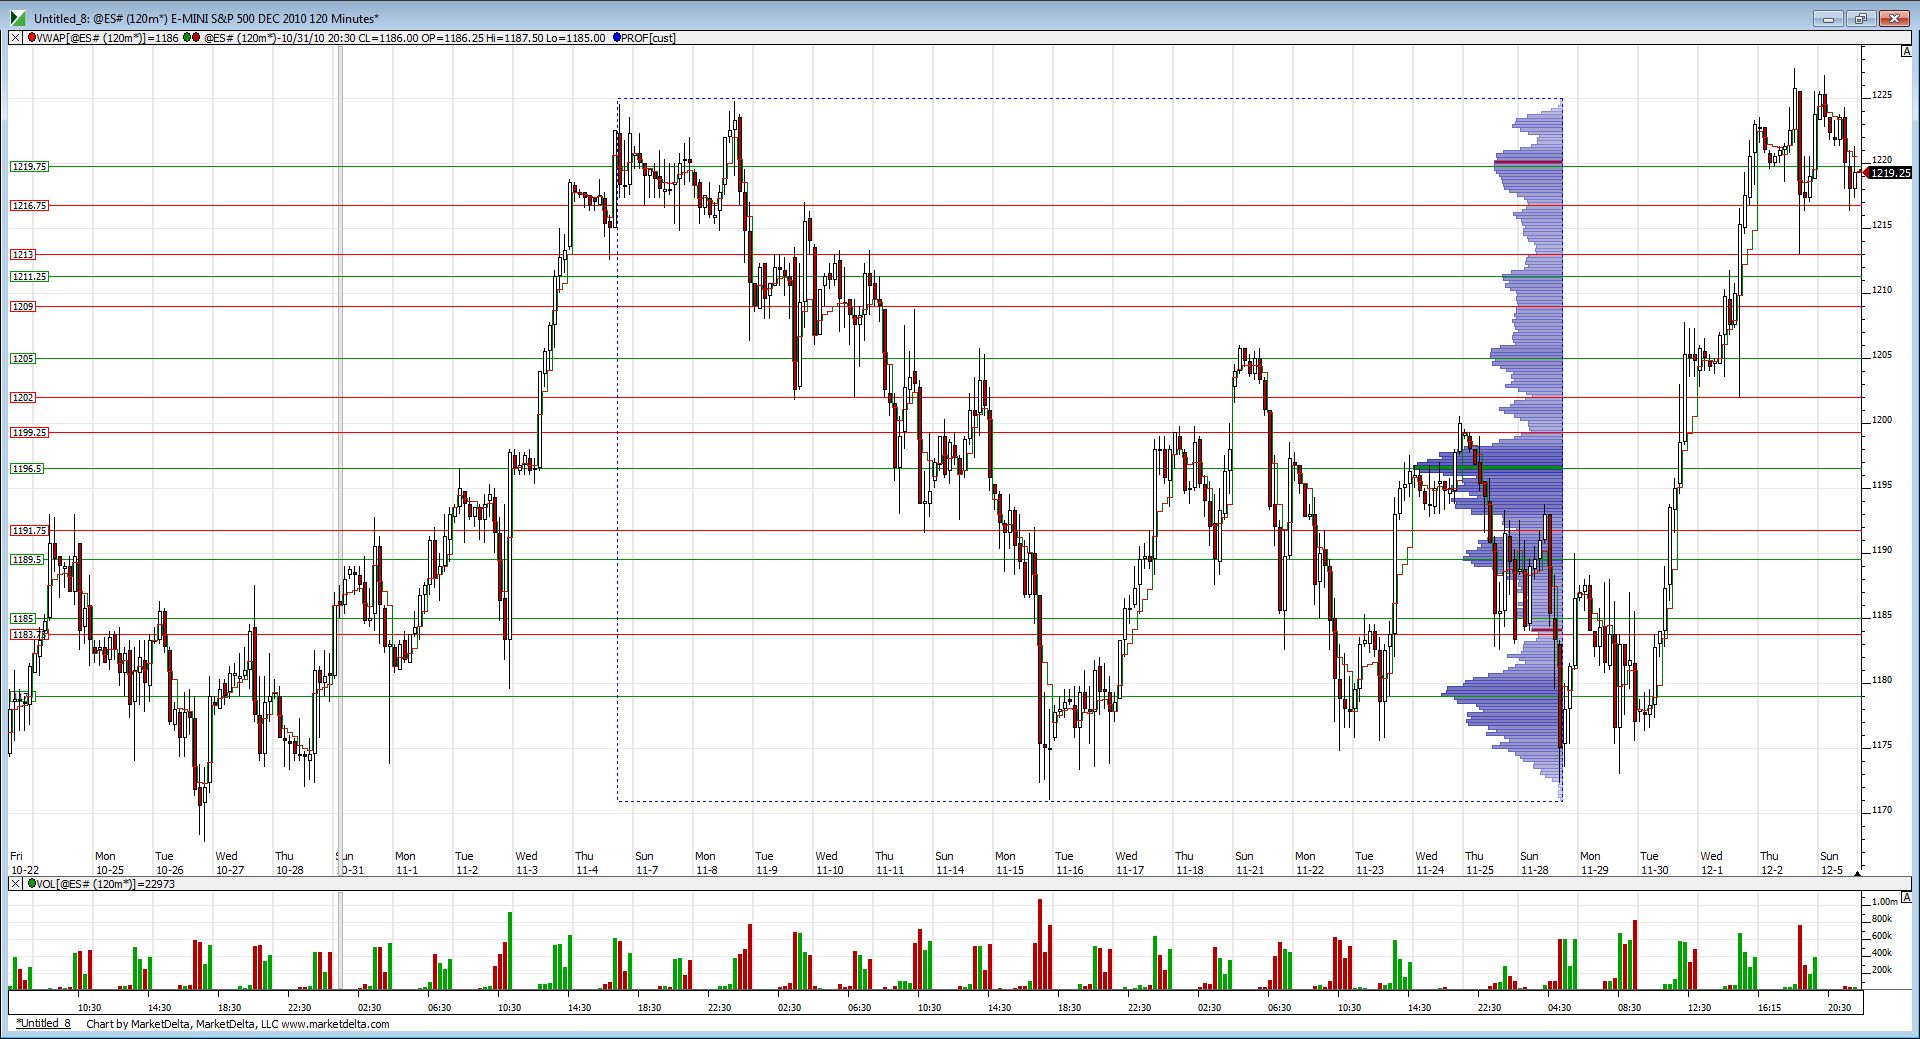
Here are two charts to take a closer look at. The first one is a daily chart with a VP drawn over the November sell off. Notice how last weeks rally found support on the LVN (red lines) as it moved up. This in my view shows buying (short covering?) supporting price.
The second chart is last weeks VP with LVN (red) and HVN (green) lines present.
The second chart is last weeks VP with LVN (red) and HVN (green) lines present.
Click image for original size
Click image for original size
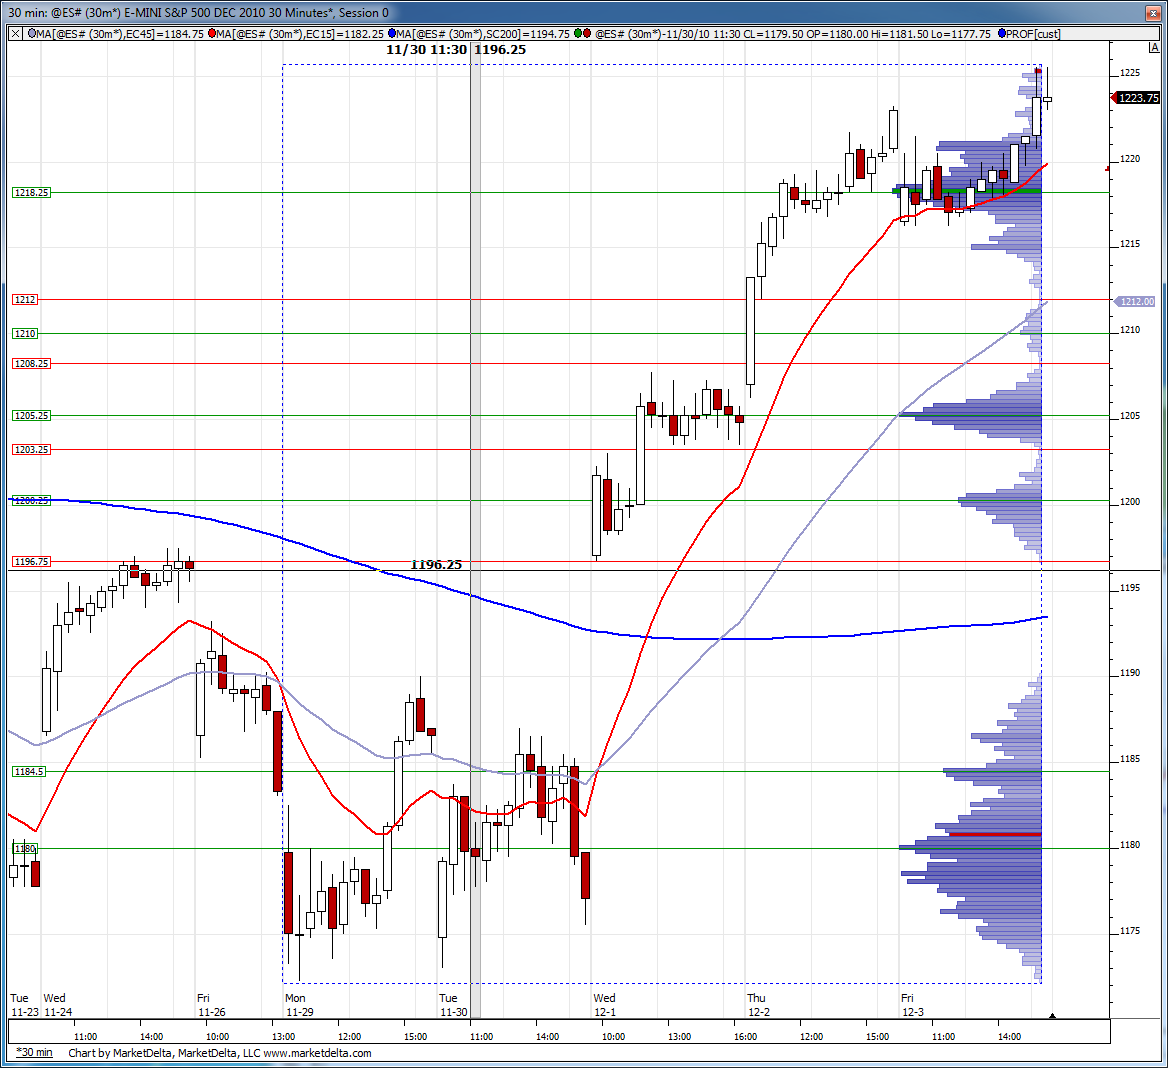
What continues to stand out to me on these charts is the low volume nodes / unfilled single prints at 1213.50 and 1211.75.
I'm looking for a test of Friday's high and possibly higher to 1231.00 late afternoon. Resistance at 1226.75
The above will be void if below 1220.00. ES now trading at 1222.75 13:31
The above will be void if below 1220.00. ES now trading at 1222.75 13:31
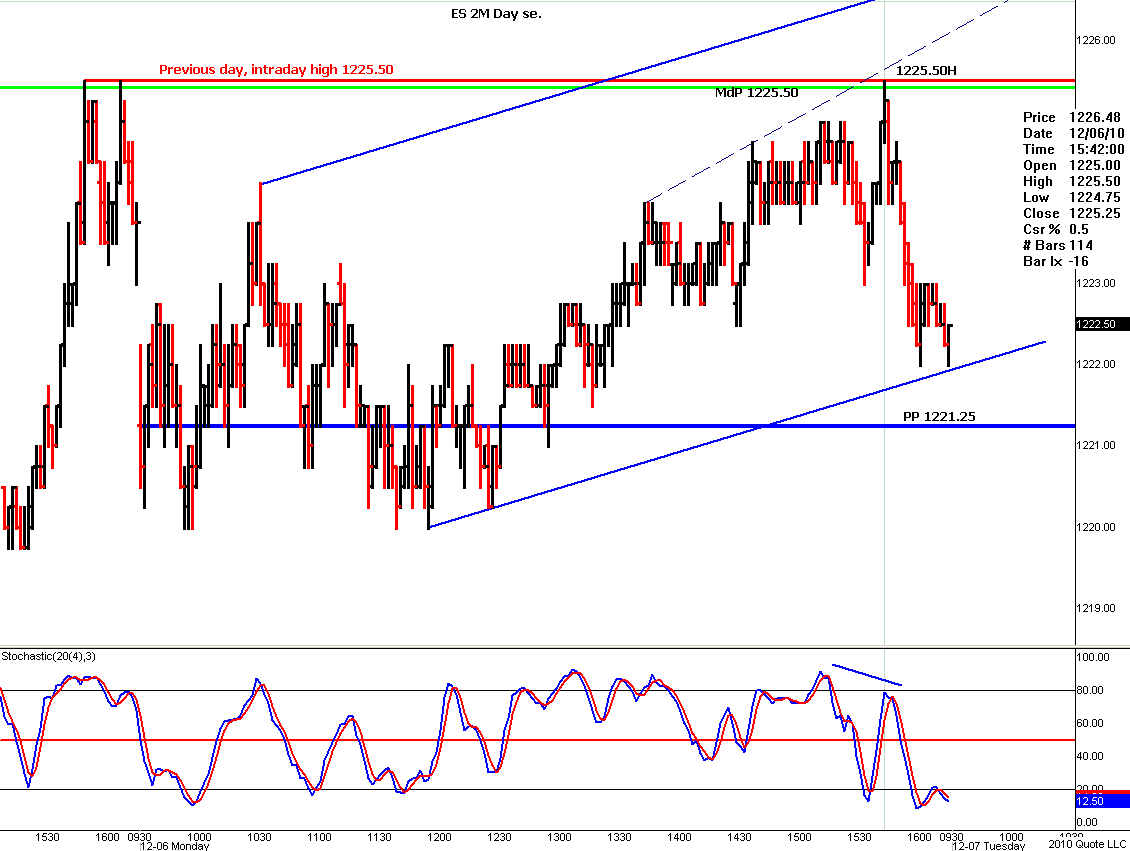
In the 2m chart below you will see the price hitting yesterday's intraday high at 1225.50. - 1225.50 was also a MdP. Notice how the resistance rejected the market, congruent with Bruce's post late afternoon.
f
f
Originally posted by i1hunter
I'm looking for a test of Friday's high and possibly higher to 1231.00 late afternoon. Resistance at 1226.75
The above will be void if below 1220.00. ES now trading at 1222.75 13:31
Click image for original size
Emini Day Trading /
Daily Notes /
Forecast /
Economic Events /
Search /
Terms and Conditions /
Disclaimer /
Books /
Online Books /
Site Map /
Contact /
Privacy Policy /
Links /
About /
Day Trading Forum /
Investment Calculators /
Pivot Point Calculator /
Market Profile Generator /
Fibonacci Calculator /
Mailing List /
Advertise Here /
Articles /
Financial Terms /
Brokers /
Software /
Holidays /
Stock Split Calendar /
Mortgage Calculator /
Donate
Copyright © 2004-2023, MyPivots. All rights reserved.
Copyright © 2004-2023, MyPivots. All rights reserved.