ES Short Term Trading for 2-25-11
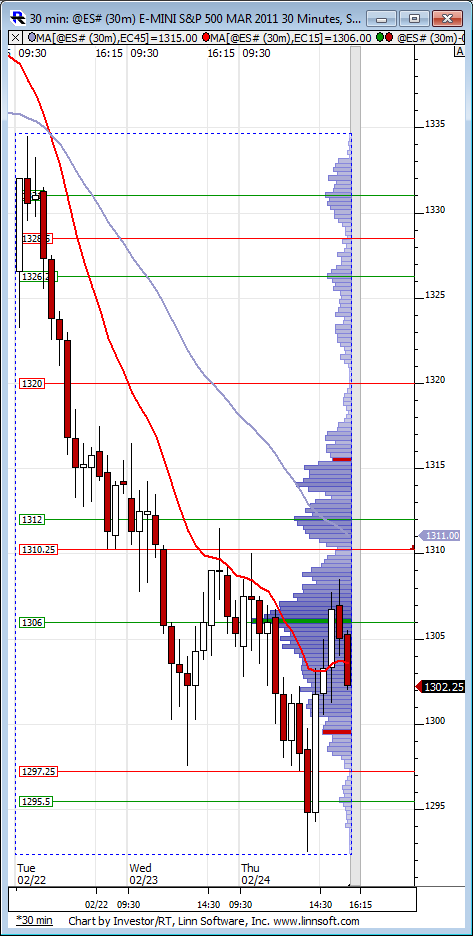
Here's my ES MAP of a 30m bars going back 20 days. The PASR levels of Red are potentially significant while Magenta is semi-significant. The White dashed lines are the Wkly Pvt levels. Also, the Volume Profile is on the right vertical side of the chart. Hope it's helpful in this whacky geopolitical event driven market. Didn't find much in the way of any Fib clusters.
The Grayed areas are the non-RTH (overnight) price activity with the Blue are RTH.
The Grayed areas are the non-RTH (overnight) price activity with the Blue are RTH.
Click image for original size

And after reviewing the daily charts of roughly 1000 stocks (didnt's view their intradays), I've got these that I'm watching as potential LONGS ... but only if the market bounces ... moves up Friday.
OPEN
SWKS
MERC
ALXN
ROK
FISV
DECK
Maybe worth watching at least!
MM
OPEN
SWKS
MERC
ALXN
ROK
FISV
DECK
Maybe worth watching at least!
MM

starting sells at 1317 today.....1318 - 1320 is key volume zone from the other day...air below and $ticks strong so using caution
Originally posted by BruceM
starting sells at 1317 today.....1318 - 1320 is key volume zone from the other day...air below and $ticks strong so using caution
I'm set to short at 1320.00(should it get there)based ongoing S/R going back to 2/08.
Bruce- looks like 1317 was a good call. If you would, what triggered your attention to 1317?
TIA
fwiw, 1317.5 was the 423.6 ext on my 1 min chart...1315 was the first extension down and 1313.5 is the next one (261.8 ext), which would take out the remaining air bruce mentioned above
i still have the 13 min chart 161.8 ext from yest lows pointing to 1318.25 (which coincidees whith the 30 min one) so that might come first and i would be a seller there
I was simply front running the volume that existed from Mondays breakdown at 1318 - 1320 and the air existed below my entry to help give me confidence...the volume cannot hide...
I keep track of the volume spikes from previous days as these become attractors..
1310 was one and look at todays low...so is 1306...( look at the overnight)and today we have 1314.75 as a volume spike that was created today...this is not VPOC's
We can mess up with how we draw our fibs or our trendlines or our projections but the volume cannot hide from us
I'm not making a trade call here but the two closest attractors are the 1323.50 area and that 1314 so one of them should still trade today...How you use the volume is up to the end user but finding the areas is not subjective! Hope that helps
Originally posted by Big Mike
Originally posted by BruceM
starting sells at 1317 today.....1318 - 1320 is key volume zone from the other day...air below and $ticks strong so using caution
I'm set to short at 1320.00(should it get there)based ongoing S/R going back to 2/08.
Bruce- looks like 1317 was a good call. If you would, what triggered your attention to 1317?
TIA
Emini Day Trading /
Daily Notes /
Forecast /
Economic Events /
Search /
Terms and Conditions /
Disclaimer /
Books /
Online Books /
Site Map /
Contact /
Privacy Policy /
Links /
About /
Day Trading Forum /
Investment Calculators /
Pivot Point Calculator /
Market Profile Generator /
Fibonacci Calculator /
Mailing List /
Advertise Here /
Articles /
Financial Terms /
Brokers /
Software /
Holidays /
Stock Split Calendar /
Mortgage Calculator /
Donate
Copyright © 2004-2023, MyPivots. All rights reserved.
Copyright © 2004-2023, MyPivots. All rights reserved.