ES 3-17-11
Click image for original size
Click image for original size
Click image for original size
Click image for original size
Click image for original size
CD stands for cumulative delta. Its exactly the same thing you have on your marketdelta grid but plotted slightly different.
Rather then plotting the data in cell format as bid vs ask its plotting that same data as straight delta (ask volume - bid volume) and then plotting that on the chart as a candlestick. The cumulative aspect comes in when the program strings the data together through time like we do with price charts. Meaning everytime (say on a 5 min chart) we get a new bar instead of starting at zero the delta just adds from the previous bars closing price. Its a chart but based on delta. hopefully that makes sense.
Rather then plotting the data in cell format as bid vs ask its plotting that same data as straight delta (ask volume - bid volume) and then plotting that on the chart as a candlestick. The cumulative aspect comes in when the program strings the data together through time like we do with price charts. Meaning everytime (say on a 5 min chart) we get a new bar instead of starting at zero the delta just adds from the previous bars closing price. Its a chart but based on delta. hopefully that makes sense.
Originally posted by Lisa P
Lorne, what is CD, please?
Originally posted by optimusprime
...
Here's the rest of the scheduled financial news today. I would keep an eye on leading idicatotrs and industrial production at 10 est.
Leading Indicators...
optimusprime - this is also available from the Economic Events link at the top of any page on the site.
the OR low need st o hold back this rally for me...a new retest up will stop me out
new sells at 72.50 for 70 retest...add point is 75
Covered my 1269 short @1266; now looking to short again @ 1275.5; not much active trading today; busy at work; good luck trading guys.
gap at 70.25 ...my least favorite target!!
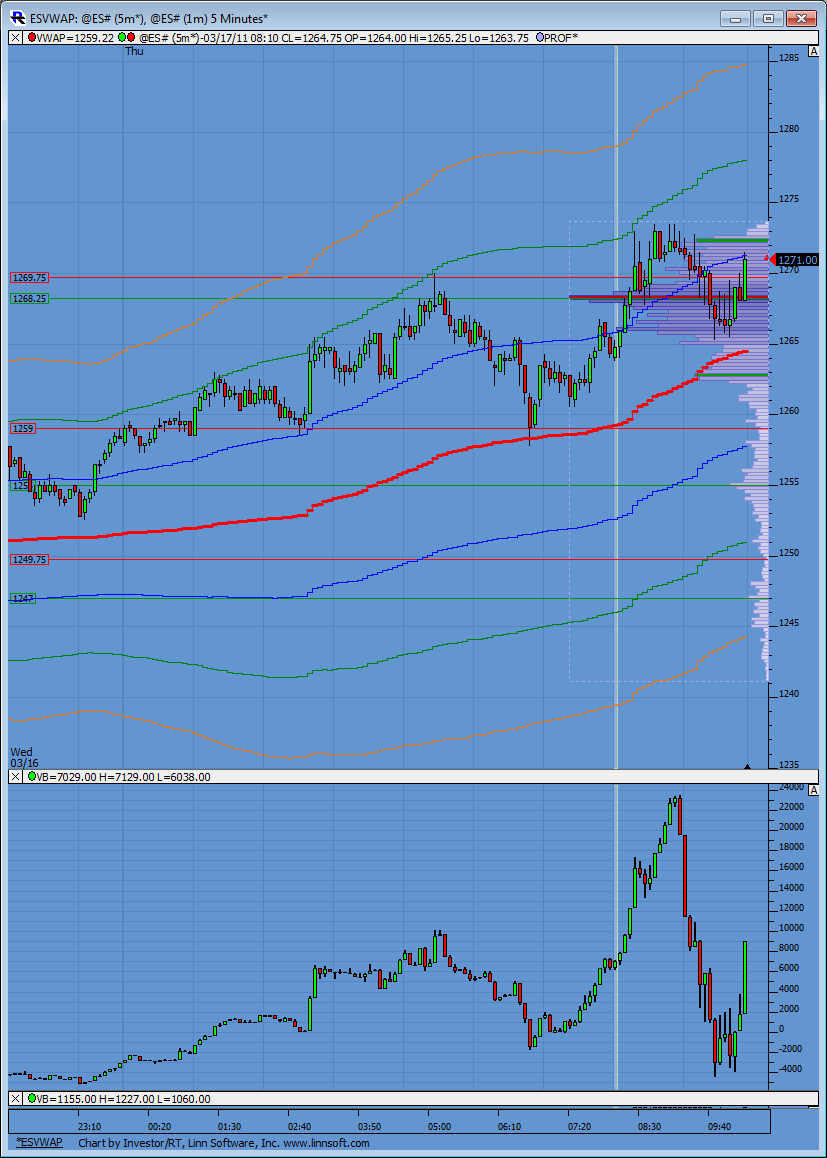
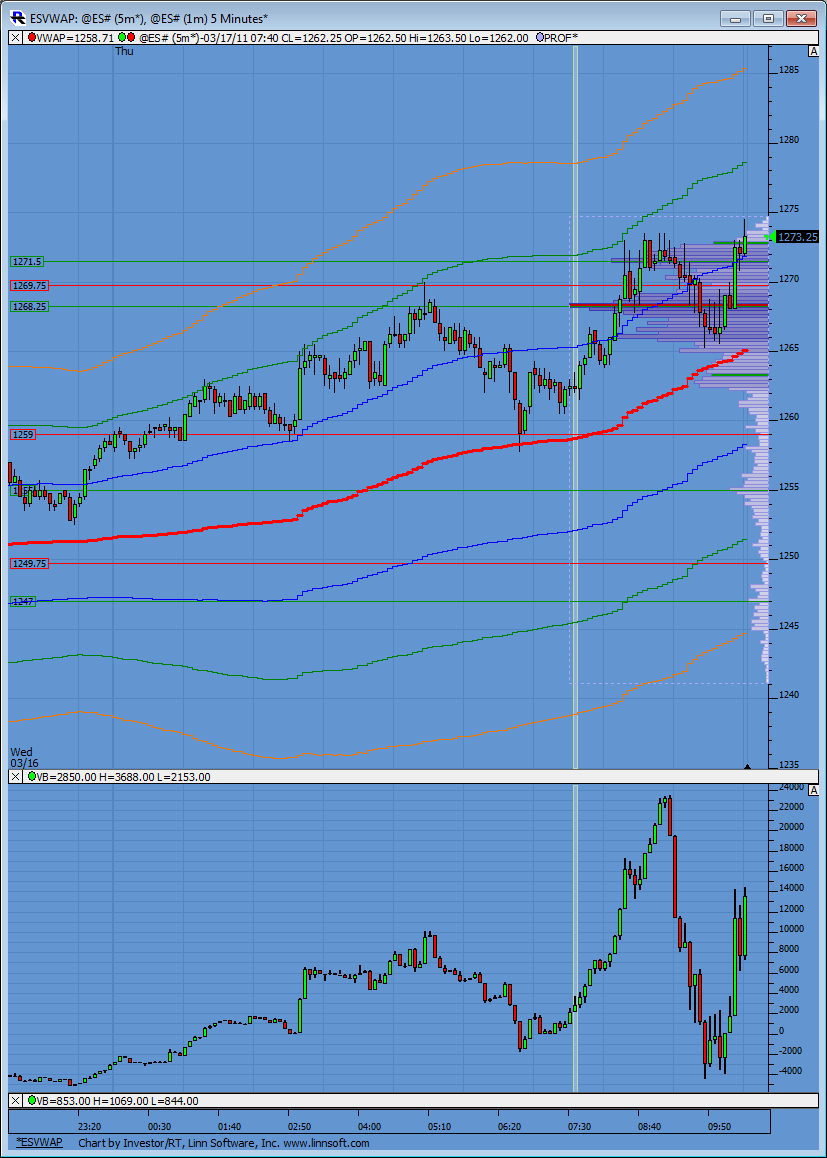
Here are some more examples for everyone to see on CD. First chart you can visually see CD rising along with prices showing that covering I referred to earlier.
Second chart is now showing a divergence as prices have climbed above the 73.50 high but CD remains below its corresponding high to 73.50. This indicates at the moment, those initial sellers of 73.50 from the 8:30 news spike are still holding short. How long they are willing to hold short is anyone's guess.
Second chart is now showing a divergence as prices have climbed above the 73.50 high but CD remains below its corresponding high to 73.50. This indicates at the moment, those initial sellers of 73.50 from the 8:30 news spike are still holding short. How long they are willing to hold short is anyone's guess.
Click image for original size
Click image for original size
flat at 72.75...don't like the way we are holding near O/N highs...will look higher up near the next zone for shorts
reshort 72.50
need to see some $tick erosion and soon otherwise we are gonna get smacked good.
a good day to study context...trade inside the previous days range and trade on both sides of the open ..multiple times...
and that 68 - 70...still like a giant magnet...look how they tried to push it up and away from there again and the volume just died on the third one minute bar....up
I'm referring to the break away they just tried at 3:45 EST...
and that 68 - 70...still like a giant magnet...look how they tried to push it up and away from there again and the volume just died on the third one minute bar....up
I'm referring to the break away they just tried at 3:45 EST...
Emini Day Trading /
Daily Notes /
Forecast /
Economic Events /
Search /
Terms and Conditions /
Disclaimer /
Books /
Online Books /
Site Map /
Contact /
Privacy Policy /
Links /
About /
Day Trading Forum /
Investment Calculators /
Pivot Point Calculator /
Market Profile Generator /
Fibonacci Calculator /
Mailing List /
Advertise Here /
Articles /
Financial Terms /
Brokers /
Software /
Holidays /
Stock Split Calendar /
Mortgage Calculator /
Donate
Copyright © 2004-2023, MyPivots. All rights reserved.
Copyright © 2004-2023, MyPivots. All rights reserved.