ES 3-31-2011
BTS, my chart of NQ shows that the price is now at the POC of congestion dated Feb 21 to March 8 (big pennant on all markets). FWIW
This is my reply to Optimus or anyone who is interested....I don't want anyone to think I'm randomly jumping up and preaching at you today...
I think Lorn covered most of the key areas. So let me tell you what I was looking at just for today. As you know I have lots of focus on market profile which has evolved to more of a volume profile look at the markets over the past few years.
With that said let me tell you how I came up with the 1324.50 number but first let me tell you what happens on most days. This will be old stuff for some.
When a big player or large block of orders comes into the market, that gets reflected in total volume. You can see that on your one minute volume histogram or even better a 30 second or even a tic chart. Now a core principle is that price is attracted to volume....it's a constant struggle between what happens at low volume areas( no big orders) and what happens at areas that attract a lot of interest, those areas where we see the volume spikes. Somebody or some group of traders liked that area enough to attempt to move the market or stop the market. It doesn't matter why....it may be a pivot, a fib, a market profile number, a previous low or high etc...it really doesn't matter why.
What usually happens after those spikes is that the volume spike areas get tested and often multiple times.....It's as if the market is probing to find out if the large buyers/sellers are REAL....are they really interested in moving the market higher or lower....? So price drifts back and forth past these numbers. When the buying or selling is real the market will test it quickly and keep going...forming trend days or trend moves. Luckily for us faders that doesn't happen much but mini trends do happen during the day and volume evolves. Pushes away from high volume spikes on low volume quite often get retested. One of the reasons I was getting short above 1326 yesterday afternoon.
Now VPOC traders take notice! Most days there is time left in the day so price gets jerked back and forth past these volume spike areas multiple times......so over time, VPOC's (Volume points of control) get created. There was no time left yesterday to create a new VPOC at that area...the 1324.50...let me back up a bit.....Many volume players will replay their volume profile chart after the market ends.....this way we can get a look at areas that attracted price and see the VPOCs as they change. I highly suggest anyone to do this. It gives you an evolving picture of what prices attracted the most interest from the previous real time session. You can see the changes from one level to the next. The changes in volume that attracted or rejected price!! Price will attempt to move between high volume prices.
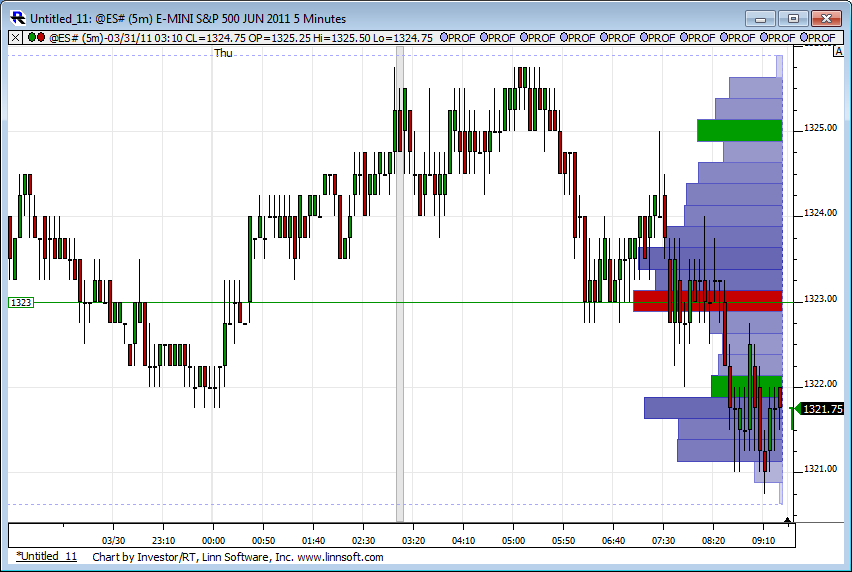
Here is a picture of yesterdays trade from about noon to the session close at 4:15 EST.
Notice the spikes in volume around 12:15 e.s.t and about 3:50.....those were created right through the 1324.50 area. I didn't have my IRT charts up yesterday afternoon but I had eyeballed the volume at 25 - 26 and mentioned that in the forum yesterday.This was incorrect as I went back to my tic chart after hours and determined that it was the 1324.50 that attracted big orders/ big volume. They can't hide from us.
Context is something we have mentioned quite often on the forum. Today we opened inside yesterdays Value area. On days like that I expect two sided trade ( trade on both sides of the opening range) and no trends unless we start getting outside the range of the previous day. Us market profile traders usually like to buy at support and sell at resistence and these types of opens are prime for that.
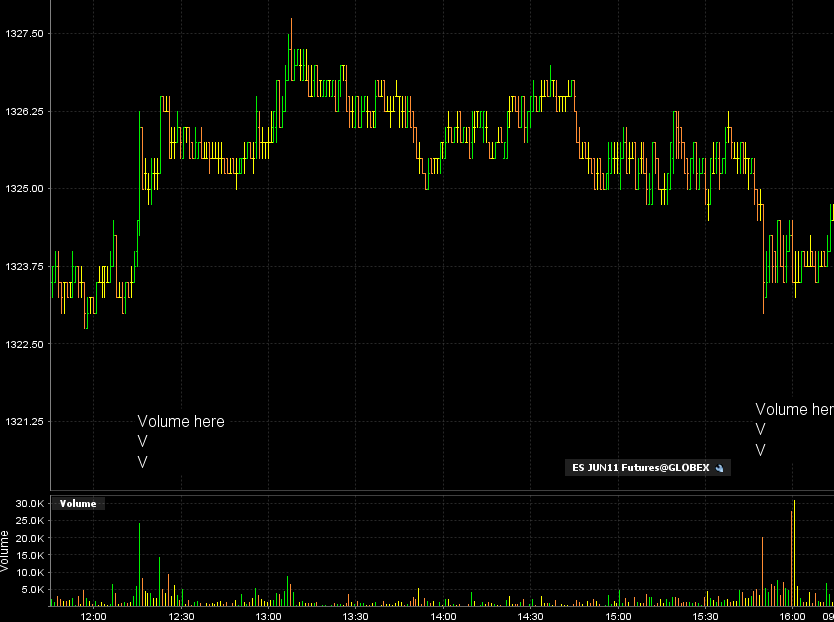
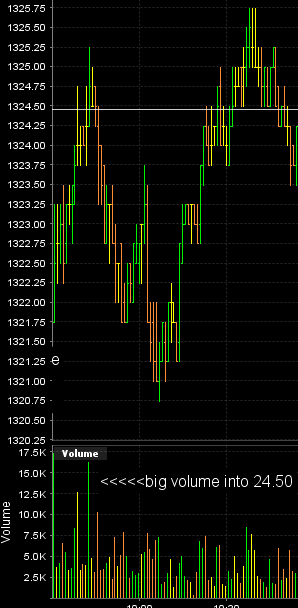
So today we opened and immediately started to rally and left air pockets behind on the 5 minute chart...not shown here but we had 3 up bars in a row. Air pockets are a top favorite...especially in the first 90 minutes of trade. We rallied right up into the 1324.50 number....and then look at the volume spike that gets created again.....TODAY!!!!...right at the 1324.50 number.!!!....so somebody likes that number for some reason...who cares why.....and so I take the short. I was prepared for that area to conduct business at. Here is the chart from early morning today..
The point of this is to have good numbers and areas you "Trust". Proven context that repeats over time.
In regards to the volume that gets created right at the open and the 4 pm close I tend to ignore it from a volume view BUT, BUT , BUT.... these are areas that I am aware of anyway. I prefer to see higher volume spikes that are bigger then the opening range spikes......On days when you don't see bigger spikes that are higher then the opening range spikes then you can use the Opening range as an attractor/magnet....Today is shaping up to be that kind of day. Many times you will see the 4:15 close happen right near a volume spike from earlier in the day too.
I try to find 3 good spikes from the previous day. Yesterday I really only could find the 1324.50. The other one was so small that I missed it and that happened at 1320.50...which happens to be the current days low. So somebody thought it mattered! It also pays to keep track of volume that gets created over time on the same day...these happen when there is no particular volume except for the opening volume...yesterday that was 1322.50. That actually showed up as the official VPOC from yesterdays trade.
Keep in mind that trade ranges have been very small so don't be turned off that these VPOC and volume spikes are happening every 3 points....this is just a function of volatility and can't be helped. When ranges expand you will see the same thing happen but will have bigger profit targets and more opportunity. For now I would concentrate on being able to find good numbers. I find that volume areas from one day become attractors for following days.
Lorn mention many key areas and that is crucial. When we can't attract Volume above/below previous highs or lows than we will drift back into the range and the volume spikes of the previous days. On Gap days and days that do accept price outside of previous ranges you will still find opportunities from the volume that is created as the day unfolds.
I hope that helps Optimus or anyone else. Ask questions or give input...there is no right or wrong answer. I value all distinctions shared about the markets. Lots of great minds here with different techniques. There's always room for improvement and when we think we have the market beat and let our guard down then we usually get humbled and we get beat down ourselves.
I think I speak for eveyone when I say that I'm looking to keep my beat downs to a minimum. Hope this helps...this little journey required my wrist brace....that thing helps tremedously.
I think Lorn covered most of the key areas. So let me tell you what I was looking at just for today. As you know I have lots of focus on market profile which has evolved to more of a volume profile look at the markets over the past few years.
With that said let me tell you how I came up with the 1324.50 number but first let me tell you what happens on most days. This will be old stuff for some.
When a big player or large block of orders comes into the market, that gets reflected in total volume. You can see that on your one minute volume histogram or even better a 30 second or even a tic chart. Now a core principle is that price is attracted to volume....it's a constant struggle between what happens at low volume areas( no big orders) and what happens at areas that attract a lot of interest, those areas where we see the volume spikes. Somebody or some group of traders liked that area enough to attempt to move the market or stop the market. It doesn't matter why....it may be a pivot, a fib, a market profile number, a previous low or high etc...it really doesn't matter why.
What usually happens after those spikes is that the volume spike areas get tested and often multiple times.....It's as if the market is probing to find out if the large buyers/sellers are REAL....are they really interested in moving the market higher or lower....? So price drifts back and forth past these numbers. When the buying or selling is real the market will test it quickly and keep going...forming trend days or trend moves. Luckily for us faders that doesn't happen much but mini trends do happen during the day and volume evolves. Pushes away from high volume spikes on low volume quite often get retested. One of the reasons I was getting short above 1326 yesterday afternoon.
Now VPOC traders take notice! Most days there is time left in the day so price gets jerked back and forth past these volume spike areas multiple times......so over time, VPOC's (Volume points of control) get created. There was no time left yesterday to create a new VPOC at that area...the 1324.50...let me back up a bit.....Many volume players will replay their volume profile chart after the market ends.....this way we can get a look at areas that attracted price and see the VPOCs as they change. I highly suggest anyone to do this. It gives you an evolving picture of what prices attracted the most interest from the previous real time session. You can see the changes from one level to the next. The changes in volume that attracted or rejected price!! Price will attempt to move between high volume prices.
Here is a picture of yesterdays trade from about noon to the session close at 4:15 EST.
Click image for original size
Notice the spikes in volume around 12:15 e.s.t and about 3:50.....those were created right through the 1324.50 area. I didn't have my IRT charts up yesterday afternoon but I had eyeballed the volume at 25 - 26 and mentioned that in the forum yesterday.This was incorrect as I went back to my tic chart after hours and determined that it was the 1324.50 that attracted big orders/ big volume. They can't hide from us.
Context is something we have mentioned quite often on the forum. Today we opened inside yesterdays Value area. On days like that I expect two sided trade ( trade on both sides of the opening range) and no trends unless we start getting outside the range of the previous day. Us market profile traders usually like to buy at support and sell at resistence and these types of opens are prime for that.
So today we opened and immediately started to rally and left air pockets behind on the 5 minute chart...not shown here but we had 3 up bars in a row. Air pockets are a top favorite...especially in the first 90 minutes of trade. We rallied right up into the 1324.50 number....and then look at the volume spike that gets created again.....TODAY!!!!...right at the 1324.50 number.!!!....so somebody likes that number for some reason...who cares why.....and so I take the short. I was prepared for that area to conduct business at. Here is the chart from early morning today..
Click image for original size
The point of this is to have good numbers and areas you "Trust". Proven context that repeats over time.
In regards to the volume that gets created right at the open and the 4 pm close I tend to ignore it from a volume view BUT, BUT , BUT.... these are areas that I am aware of anyway. I prefer to see higher volume spikes that are bigger then the opening range spikes......On days when you don't see bigger spikes that are higher then the opening range spikes then you can use the Opening range as an attractor/magnet....Today is shaping up to be that kind of day. Many times you will see the 4:15 close happen right near a volume spike from earlier in the day too.
I try to find 3 good spikes from the previous day. Yesterday I really only could find the 1324.50. The other one was so small that I missed it and that happened at 1320.50...which happens to be the current days low. So somebody thought it mattered! It also pays to keep track of volume that gets created over time on the same day...these happen when there is no particular volume except for the opening volume...yesterday that was 1322.50. That actually showed up as the official VPOC from yesterdays trade.
Keep in mind that trade ranges have been very small so don't be turned off that these VPOC and volume spikes are happening every 3 points....this is just a function of volatility and can't be helped. When ranges expand you will see the same thing happen but will have bigger profit targets and more opportunity. For now I would concentrate on being able to find good numbers. I find that volume areas from one day become attractors for following days.
Lorn mention many key areas and that is crucial. When we can't attract Volume above/below previous highs or lows than we will drift back into the range and the volume spikes of the previous days. On Gap days and days that do accept price outside of previous ranges you will still find opportunities from the volume that is created as the day unfolds.
I hope that helps Optimus or anyone else. Ask questions or give input...there is no right or wrong answer. I value all distinctions shared about the markets. Lots of great minds here with different techniques. There's always room for improvement and when we think we have the market beat and let our guard down then we usually get humbled and we get beat down ourselves.
I think I speak for eveyone when I say that I'm looking to keep my beat downs to a minimum. Hope this helps...this little journey required my wrist brace....that thing helps tremedously.
Originally posted by optimusprime
ok, i am seriously frustrated, how is it everyone seems to know the direction of the market today or any day but me? what is it on a an intraday level everyone looks at to determine levels to buy and sell for scalping? I understand the fib ext and pulling both sides... what else is it that is used to to determine levels?
BACK... very nice concise explanation of your methods ,Bruce.. sometimes i wish we had D.T. gather up these posts and put them somewhere for all newer traders who want to learn our methods!...well done!
Bruce, thank you very much for your trading lesson. I have aquestion. How do you pick out the high volume level, while looking at a bar (price range)?
Thanks for taking the time to write this up Bruce, good to see your perspective on things.
Originally posted by BruceM
This is my reply to Optimus or anyone who is interested....I don't want anyone to think I'm randomly jumping up and preaching at you today...
I think Lorn covered most of the key areas. So let me tell you what I was looking at just for today. As you know I have lots of focus on market profile which has evolved to more of a volume profile look at the markets over the past few years.
are you refering to the one minute bars I watch Lisa....? How do I find it off a time based chart? I want to make sure I understand your question
Originally posted by Lisa P
Bruce, thank you very much for your trading lesson. I have aquestion. How do you pick out the high volume level, while looking at a bar (price range)?
BruceM, yes, how do you find the pricise level off the time chart bars on your 1 min. Those bars could be long.
I noticed the same thing, that each 1m price bar obviously has a range, like yesterday's vol spike at 12:15, the bar ranges from 1324.25 to 26.25. So how do you pick an exact price level?
Originally posted by BruceM
are you refering to the one minute bars I watch Lisa....? How do I find it off a time based chart? I want to make sure I understand your questionOriginally posted by Lisa P
Bruce, thank you very much for your trading lesson. I have aquestion. How do you pick out the high volume level, while looking at a bar (price range)?
Originally posted by koolblue
somehow,pal, we really need to consolidate all of our 'teaching' dialogues... and other folks also. P.T.'s had a few , Paul,Lorns,etc and put them all in one easy place to find! Im pretty good at finding stuff and would be willing to spend a weekend doing it, if D.T. agrees, but i fear if we dont, in a couple months,or a year it'll be hard to find(in effect lost!). Another good example is Charter Joes mini ib method... I feel it would be invaluable to newer traders!... thx again!
I can certainly help with that. I wonder if the dictionary would be the right place to put it? The site is setup so that I can auto-link certain words to the dictionary - as most of you already know. So if we came up with names for the strategies, setups, methods and techniques then we could add each one of them to the dictionary as a distinct item and then auto-link them from here. For example, we could call one "Bruce's Air" and that would link to something like this:
http://www.mypivots.com/dictionary/definition/407/air-pocket
which was taken from something that Bruce wrote.
It seems to be the most obvious place to collect the information. Also the dictionary also has a fast lookup search bar.
If you want to experiment with this idea try and add one from here:
http://www.mypivots.com/dictionary/create
and I'll help clean it up and then add the auto-link words.
Good idea and great stuff guys!
Emini Day Trading /
Daily Notes /
Forecast /
Economic Events /
Search /
Terms and Conditions /
Disclaimer /
Books /
Online Books /
Site Map /
Contact /
Privacy Policy /
Links /
About /
Day Trading Forum /
Investment Calculators /
Pivot Point Calculator /
Market Profile Generator /
Fibonacci Calculator /
Mailing List /
Advertise Here /
Articles /
Financial Terms /
Brokers /
Software /
Holidays /
Stock Split Calendar /
Mortgage Calculator /
Donate
Copyright © 2004-2023, MyPivots. All rights reserved.
Copyright © 2004-2023, MyPivots. All rights reserved.