MyPivots
Sign In
DU
Duane
Rep: 100
Posts: 1,095
Hi Jim,

Thanks for opening this Forum to your students and giving us an opportunity to show our charts and share our ideas.

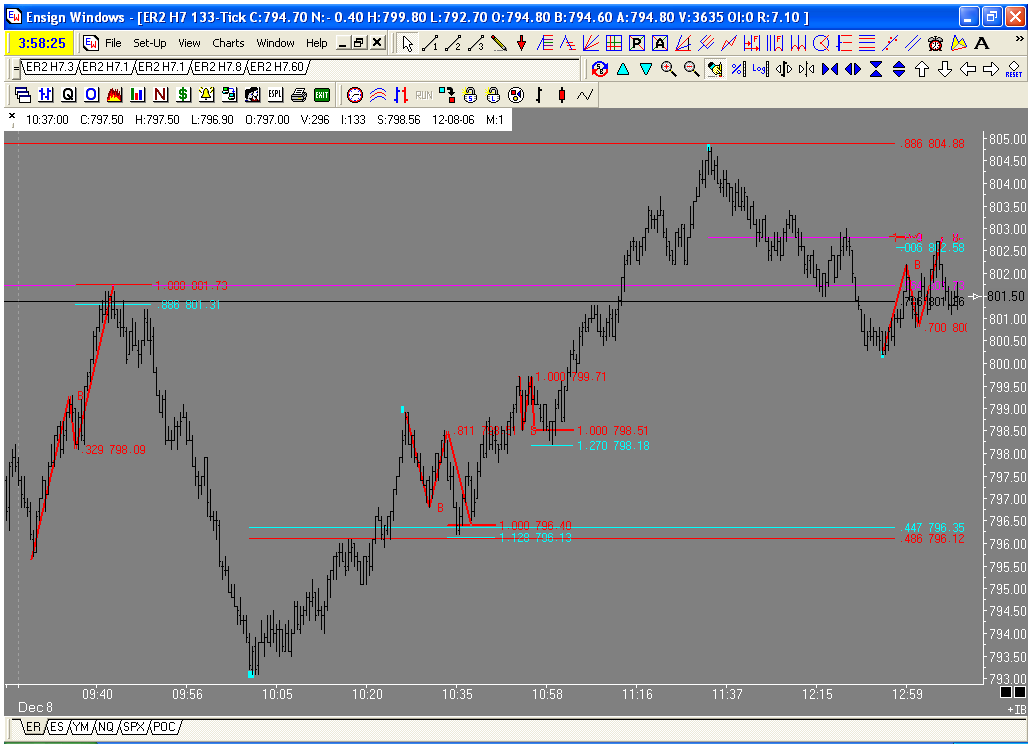
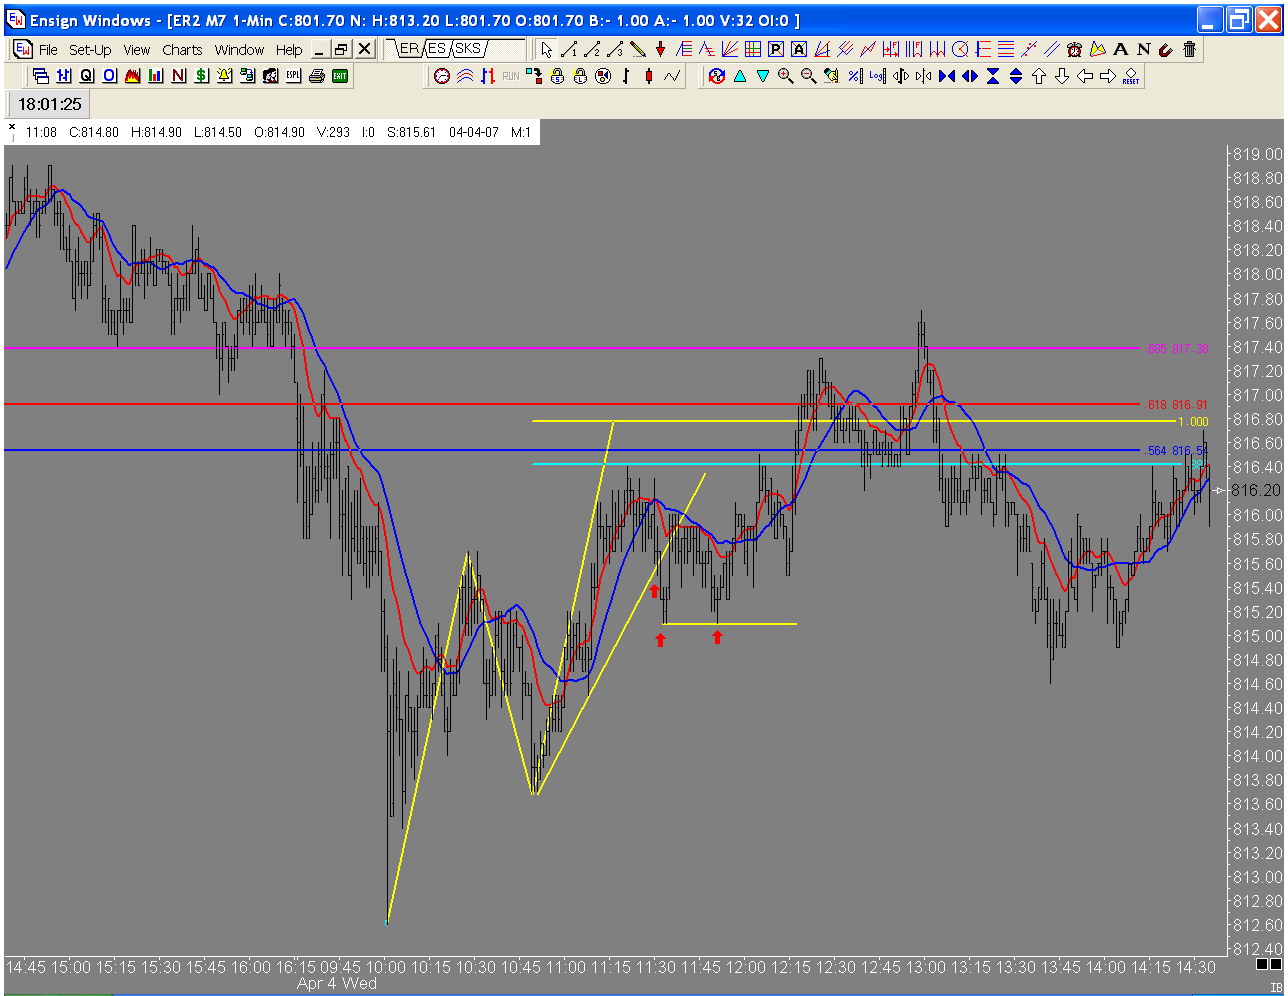
Here is a chart of todays ABCD's in the russell. I will post a context chart later. Today was one of those days where the market changes direction on Jim's unique Fib numbers, Had you been trading with standard fib numbers you may not have noticed these PTA's. Is it me or is .564 becomming more and more prevalent?

Click image for original size
No Description Entered
JI
jimkane
Rep: 3,058
Posts: 33,089
Yeah, the KT rocking chair pattern failure setup. Sorry, I forgot to explain that one from before. Here's what I see. I have a big, very key pattern. I get the expected reaction off that, and it sells (in the case of a short pattern), usually to an expected spot. It then bounces up in the first correction of the new possible trend. So far, so good. It then rolls back over. Everything is on track at this point. But this is 'wave 3' supposedly, or 'wave 3 of wave 1'. This wave should accelerate. It stops somewhere near the previous swing, slightly above, below, or equal to it, and then starts back up. Although it is possible for this to be a 'wave 2 of wave 3', it's unlikely.

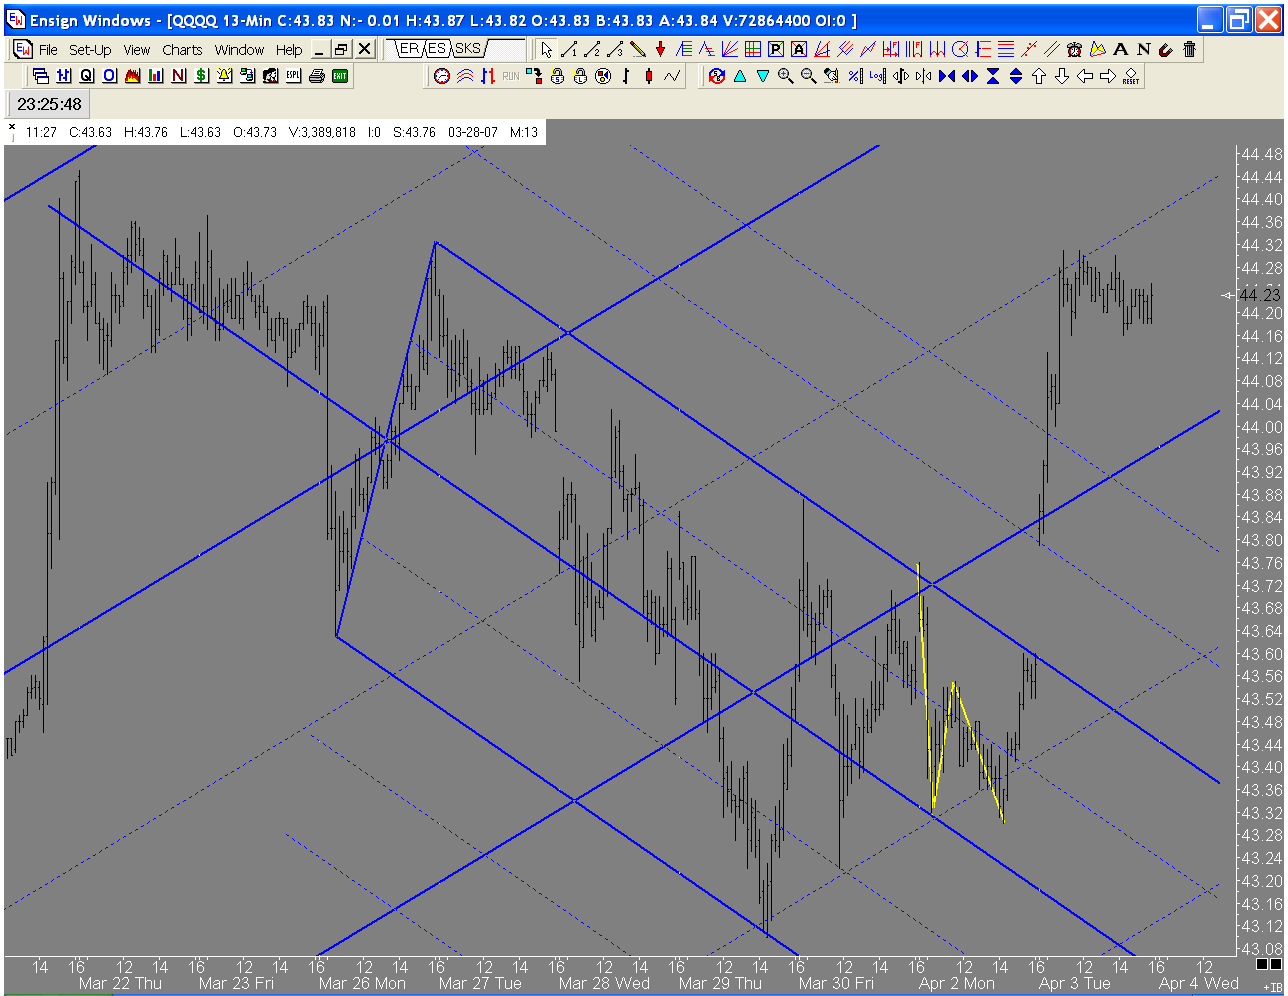
Now, here's the key for me. There is usually a very noticeable line right in here, not only over the recent peaks, but from before, usually the line the setup was based on. It usually closes right here. Although it could roll right off this spot, it seems to gap or explode up. This price action is not in keeping with the setup and layout. It frequently looks like a rocking chair, but it needs the key line, and all based on a big setup with respect to the current swing sizes. Look back to that 4-Point and the other example I mentioned. Your example is a classic case. You have a 4-Point, it makes the outlined moves, right to the trendline, where it closes. Next day a big gap and run. The 'KT rocking chair pattern failure setup'. Nice work.

P.S. Show the downsloping set for the 4-Point, based on the previous 'wave 2' to see the line I was watching, and where this closed. Also, this pattern seems to work the best with 4-Points in my experience, but it applies anywhere it sets up. I'm still developing it.
DU
Duane
Rep: 100
Posts: 1,095


Click image for original size
No Description Entered
JI
jimkane
Rep: 3,058
Posts: 33,089
Cool, huh?
TO
TonyC
Rep: 99
Posts: 471
Jim,
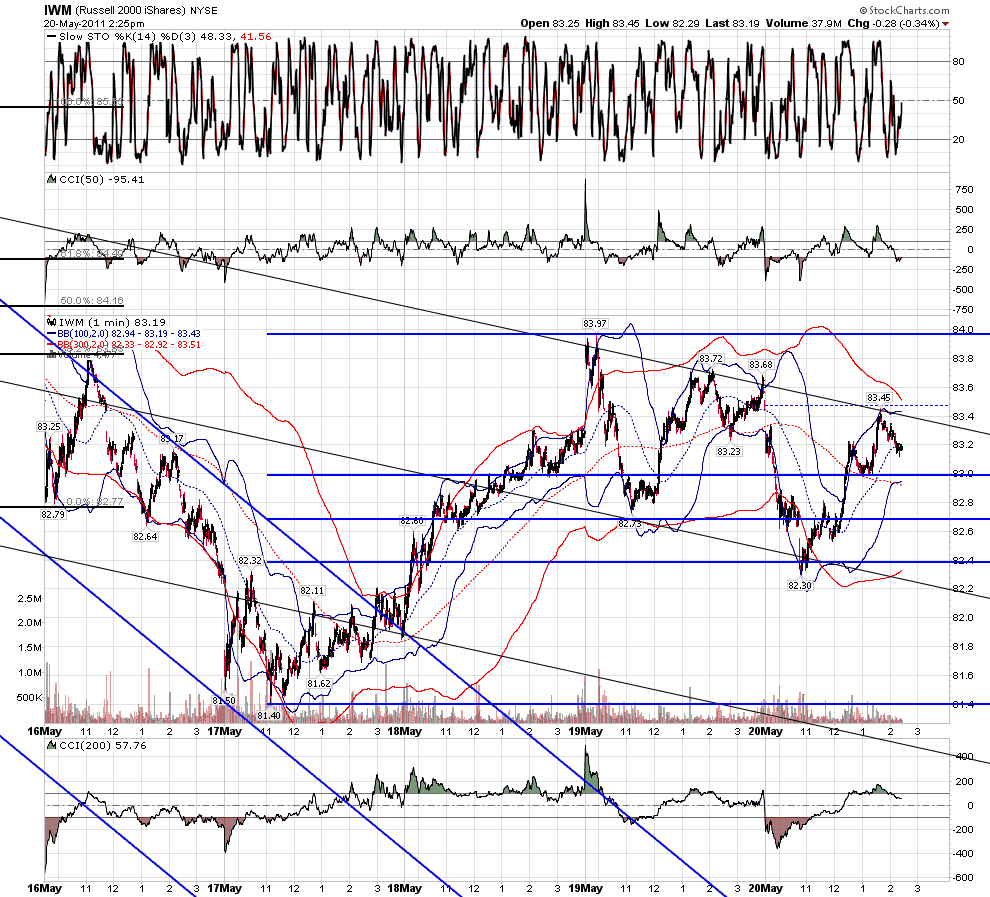
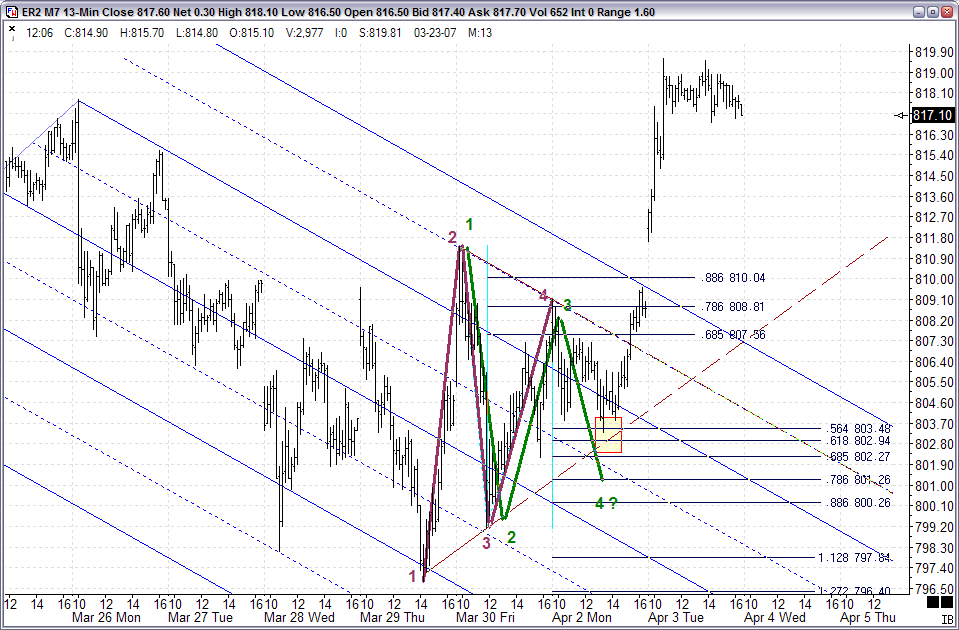
Thank you for giving us details on the 'KT rocking chair' pattern.In my work with pattern morphing and combinations, I have found a similar pattern that is just like what u have described, a 'wave2-4PC' I called it,it's a 4PC within another 4PC(the way I see it) where leg 1-2 of the first 4PC can be wave 1 (it's a single leg trend pullback in the beginning) and wave 2 would be the second 4PC pattern wich starts at point 2 of the first 4PC. I like to see it this way so it makes 'sense' to me because the second 4PC would be setup to continue the trend direction of wave 1 wich,alternatively, is leg1-2 of the first 4PC. That way we still wouldn't attempt to call it a 'reversal' pattern,thus not calling the end of a trend with the pattern setup(ow..blasphemy!).Sorry that might be confusing for some but the concept is rather simple.The first reaction bounce leg off the first 4PC pattern is in this case, the leg 3-4 for the second 4PC
Now, my own personal PTA parameters for that pattern had me waiting a little bit lower at the classic PTA zone for a 4PC as defined by you,Jim, in ur 4PCP article.I admit it took me off-guard when it turned and exploded from the .564 area yesterday,so I kind of missed the pattern's primary entry triggers I had to play catchup with the tiny pullbacks along the way up,wich btw gave me some sweat with higher execution slippage etc,.It's okay though, since that"KT rocking chair" pattern set up the context for plays in the direction of the new trend.
It's just amazing to me how I can relate my independent work to some of yours.So Im thinking Im moving in the right direction, I hope.
My comments are just 'concept' viewpoint from my part. I admit ur description is more practical and useful though. I Just wanted to share what I had on the subject.
Regards,
T
here's the chart:

Click image for original size
No Description Entered
RO
roofer
Rep: 3,689
Posts: 3,574
chart

Click image for original size
BU
butch1130
Rep: 0
Posts: 38
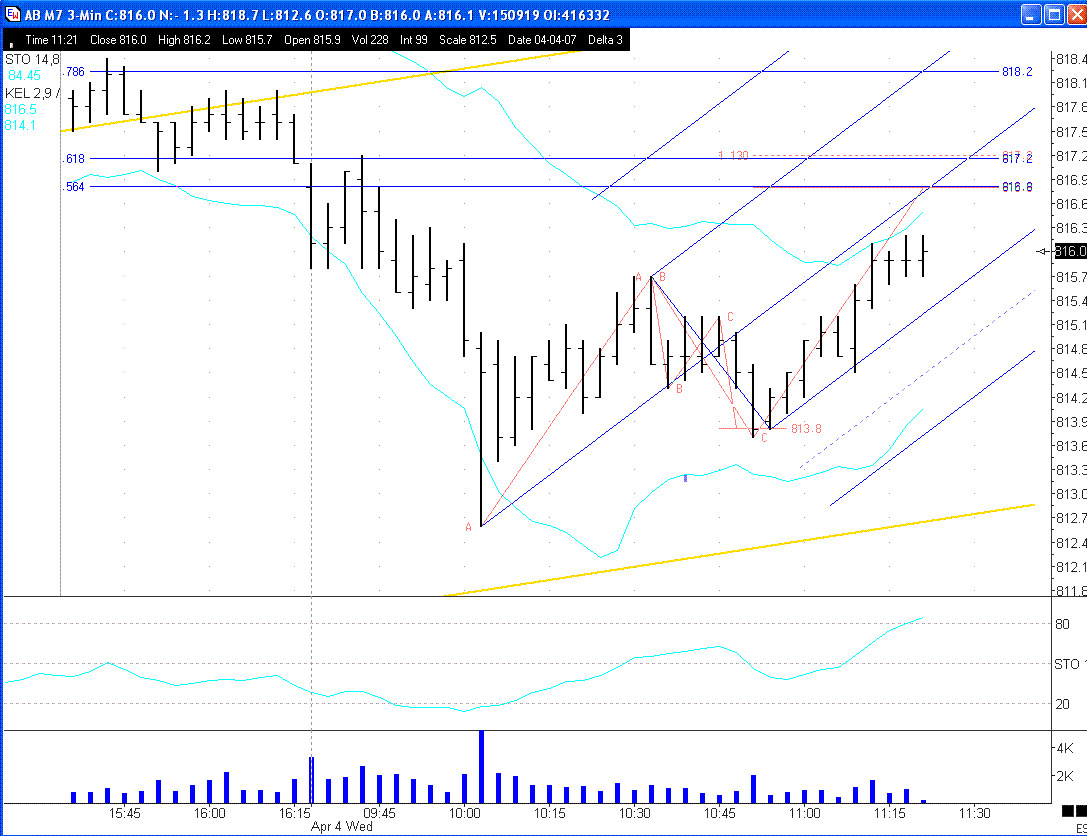
Any thoughts on this potential ABCD completing at around 816.8 ?

ABCD in the BC leg.

Click image for original size
No Description Entered
TO
TonyC
Rep: 99
Posts: 471
Butch,
Im looking at the same thing as U, as well as millions of other traders..this one looks good but is too perfect IMO..I'd be careful because this is an obvious one.The structure looks totally right and it completes at the area of the daily pivot.Watchout!.
T
MR
mreiserer
Rep: 110
Posts: 2,220
Almost looks too big for a correction.
DU
Duane
Rep: 100
Posts: 1,095
Possible trade entries.

1. Arrow to left, first close after MA cross - stopped out

2. Next arrow, trendline break - stopped out

3. Next arrow, swing low violation - no trade

Please note, risk increases as entry point moves further from logical stop placement.


Click image for original size
No Description Entered
MR
mreiserer
Rep: 110
Posts: 2,220
Obviously I am not as experienced as you guys with Russell, but personally I have found the last two days very difficult to trade. Either no good setups or setups that look decent and turn out to be crapshoots. Maybe it's just me.
RO
roofer
Rep: 3,689
Posts: 3,574
thankyou duane i knew it was back there somewhere...