ES 5-18-2011
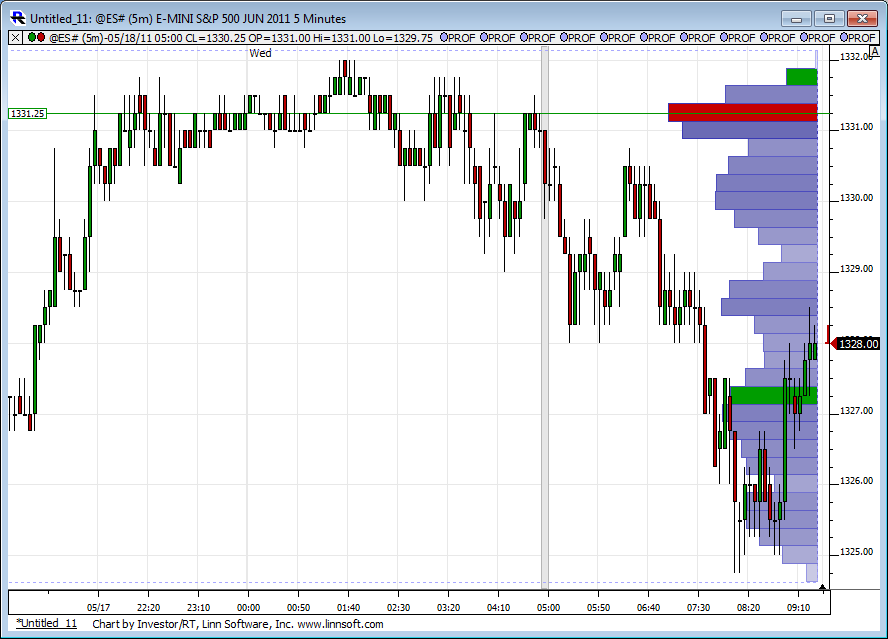
flat here...i did not understand the price action heading into the minutes...stocks were up (that part i understand), but the dollar index also made a run up and now is retracing as sotkcs have moved south...broken correlation between those two
thats me flat at 35.25 print...close enough..
Had 3 from 36.75 and 6 from 39.75...those are actuals... just too close to hold
Had 3 from 36.75 and 6 from 39.75...those are actuals... just too close to hold
Filled that Running Triple at 35.25
32.75 and 33.50 is VPOC as per time and volume so if u holders get the continued sell off then that is a good target...good luck !
Originally posted by BruceM
32.75 and 33.50 is VPOC as per time and volume so if u holders get the continued sell off then that is a good target...good luck !
And that's R1 at 1333.00 ;]
cool..so lots of players in that area..this is too late in the day for me....once outside 60/90 minute range and previous day and Overnight ranges then my odds for a good trade go down...I just need those reference points...
Lisa,
I had suggested on another day trading thread that you might want to make some videos of how u read the footprint..This way those who don't do the skype thing can still benefit from your knowledge....any interest on your part?
Might be very useful....and just so everyone reading is aware, Lisa has been very generous to offer skype for those looking for footprint awareness...
sellers really trying at this 34.75 - 35 area.assuming I know what this footprint is showing.....
a low volume area that sellers are trying to take over..
a low volume area that sellers are trying to take over..
Daniel,
You've seen my obsession for triples. It's my understanding that triples develop and price moves down.
It appears that you took the triples up. Am I seeing things properly?
Triples at 1335.25... up to 1340ish, back to current 1335.
Still trying to get it(triples) clear and your thoughts on going the opposite direction.
Originally posted by neoikon
Filled that Running Triple at 35.25
it seems to me that the real key to all this footprint stuff is figuring out when heavy ask volume is REALLY buying and when heavy bid volume is REALLY selling.....
It seems to lack a filter to really help us figure that crucial question out..
I see heavy Bid volume at 34.75 but it is not selling off...but by the time you figure that out the market is 1.75 - 2 points higher...
It seems to lack a filter to really help us figure that crucial question out..
I see heavy Bid volume at 34.75 but it is not selling off...but by the time you figure that out the market is 1.75 - 2 points higher...
Originally posted by BruceM
it seems to me that the real key to all this footprint stuff is figuring out when heavy ask volume is REALLY buying and when heavy bid volume is REALLY selling.....
It seems to lack a filter to really help us figure that crucial question out..
I see heavy Bid volume at 34.75 but it is not selling off...but by the time you figure that out the market is 1.75 - 2 points higher...
Bruce, it is a bitch! Tha is what trading long at resistance is like.
But I am not going to write another long answer. Skype me...lol.
Emini Day Trading /
Daily Notes /
Forecast /
Economic Events /
Search /
Terms and Conditions /
Disclaimer /
Books /
Online Books /
Site Map /
Contact /
Privacy Policy /
Links /
About /
Day Trading Forum /
Investment Calculators /
Pivot Point Calculator /
Market Profile Generator /
Fibonacci Calculator /
Mailing List /
Advertise Here /
Articles /
Financial Terms /
Brokers /
Software /
Holidays /
Stock Split Calendar /
Mortgage Calculator /
Donate
Copyright © 2004-2023, MyPivots. All rights reserved.
Copyright © 2004-2023, MyPivots. All rights reserved.