ES 5-18-2011
Originally posted by PAUL9
LisaP,
hope all is well, haven't seen you for a couple of days.
Your interpretation of the size at 1333.00? (both columns I noticed)
If price dips below that 33 by a few ticks are you expecting liquidation of longs? Is that the standard interpretation?
thx
Hi Paul9 (and everyone) . I was off for about a week - computer issues,insurance issues...
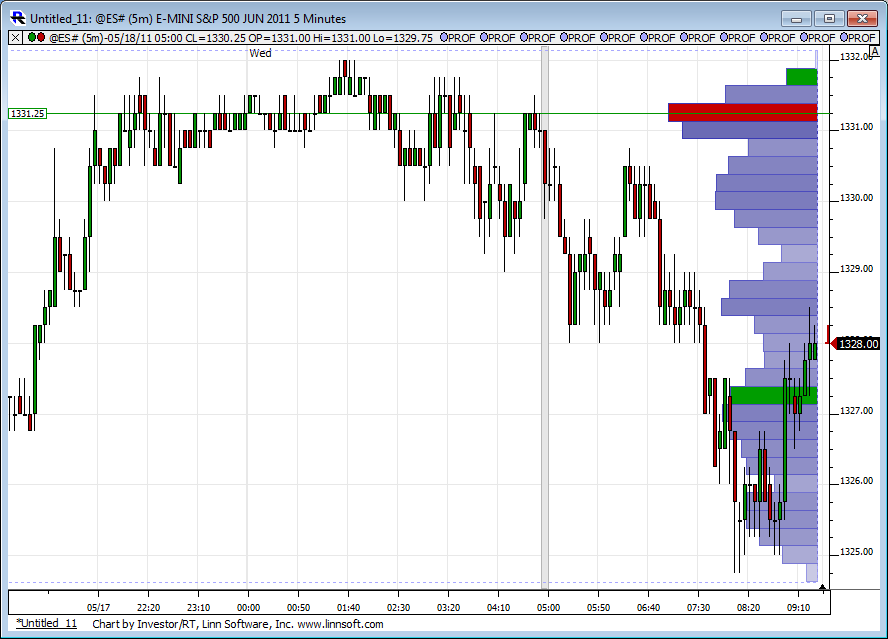
I watch the action when I see a big number. So bulls are hitting the ask, market should go up, but it stalls. Then I watch a pullback (minnows - 1-min players - exiting). If their number is relatively small, I stay in the long trade with Mr. BigWig. If the pullback numbers are significant, I exit. This pullback was on a very low volume, so I am still in the long trade. Hopefully the target is gap above closing
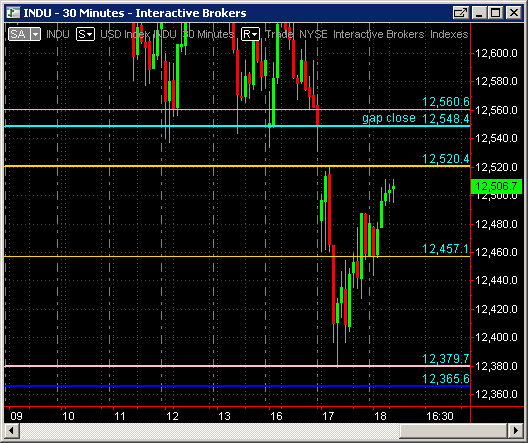
Here is the chart I am watching. Bottom of the gap is also resistance. We are at it for a while, so may chew through. NQ is helping
Click image for original size
Monday's "virgin" POC is at 1335.25 on my chart - will take some off there
took small profit and got out - not my favorite trade (buying into Resistance), especially after 10-handle run up on the FOMC day , at lunch...lol.
no reason yet why we won't revist 32.50 ....gonna take a boat load of volume......to break away....like a 2 pm report...oh yeah, that could do it......till then we should mean revert..
shorting into 36.50 now...watching trade above 37 with volume as that is far end of upper range and VA high from that day...
52.8% from R1 to R2 at 1337. May off resistance.
34.50 - 34.75 is target...that would be SECOND set of single prints today ...unusual !!
I'm posting more today, because it's slow. Hope it's ok.
Calculated this against my numbers and got 1336.83... or, 1337. Thanks for your post!
Calculated this against my numbers and got 1336.83... or, 1337. Thanks for your post!
Originally posted by neoikon
52.8% from R1 to R2 at 1337. May off resistance.
Originally posted by BruceM
it seems to me that the real key to all this footprint stuff is figuring out when heavy ask volume is REALLY buying and when heavy bid volume is REALLY selling.....
It seems to lack a filter to really help us figure that crucial question out..
I see heavy Bid volume at 34.75 but it is not selling off...but by the time you figure that out the market is 1.75 - 2 points higher...
Bruce, it is a bitch! Tha is what trading long at resistance is like.
But I am not going to write another long answer. Skype me...lol.
Emini Day Trading /
Daily Notes /
Forecast /
Economic Events /
Search /
Terms and Conditions /
Disclaimer /
Books /
Online Books /
Site Map /
Contact /
Privacy Policy /
Links /
About /
Day Trading Forum /
Investment Calculators /
Pivot Point Calculator /
Market Profile Generator /
Fibonacci Calculator /
Mailing List /
Advertise Here /
Articles /
Financial Terms /
Brokers /
Software /
Holidays /
Stock Split Calendar /
Mortgage Calculator /
Donate
Copyright © 2004-2023, MyPivots. All rights reserved.
Copyright © 2004-2023, MyPivots. All rights reserved.