ES 5-18-2011
I actually jumped in when the talk about VPOC, High Vol at 1336.5 and the R1 level at 1333... my target as well. Then I experience exactly what you've written here, lost my nerve and pulled out.
My reasoning... Still too early. I feel if it's going to happen, which I'm hoping will (from the bench), it will be closer to 4pm. My hearts not yet strong enough to go 1hr plus!
My reasoning... Still too early. I feel if it's going to happen, which I'm hoping will (from the bench), it will be closer to 4pm. My hearts not yet strong enough to go 1hr plus!
Originally posted by BruceM
it seems to me that the real key to all this footprint stuff is figuring out when heavy ask volume is REALLY buying and when heavy bid volume is REALLY selling.....
It seems to lack a filter to really help us figure that crucial question out..
I see heavy Bid volume at 34.75 but it is not selling off...but by the time you figure that out the market is 1.75 - 2 points higher...
Originally posted by TradeQueen
Daniel,
You've seen my obsession for triples. It's my understanding that triples develop and price moves down.
It appears that you took the triples up. Am I seeing things properly?
Triples at 1335.25... up to 1340ish, back to current 1335.
Still trying to get it(triples) clear and your thoughts on going the opposite direction.
I didn't mean to imply that I took a trade in either direction based on the Running Triple. I was merely saying that the running triple that occurred at 35.25 was "filled". From my understanding, when we have three (or more) 5-min bars with the same low or same high, then chances are we will trade back to that level within the same day. In this case, we did (down to 34.75).
The way I would read this is that if I was looking to go long some place above that 35.25, then it's important to realize that chances are we may return to that 35.25 sometime that day. So, until that happens, continuing long would be riskier.
Originally posted by neoikon
The way I would read this is that if I was looking to go long some place above that 35.25, then it's important to realize that chances are we may return to that 35.25 sometime that day. So, until that happens, continuing long would be riskier.
I would equate it to something like the daily gap fill. Chances are, the daily gap will fill the same day (something around 80% chance), so until the gap is filled, trading against that fill would be riskier.
Very clear. Thank you very much.
Originally posted by neoikon
Originally posted by neoikon
The way I would read this is that if I was looking to go long some place above that 35.25, then it's important to realize that chances are we may return to that 35.25 sometime that day. So, until that happens, continuing long would be riskier.
I would equate it to something like the daily gap fill. Chances are, the daily gap will fill the same day (something around 80% chance), so until the gap is filled, trading against that fill would be riskier.
I'm sure everyone is done for the day and no one will ever read this, but it seems the market is bouncing back and forth between the Weekly PP (1340.25) and the Monthly PP (1338).
Who will win?
Who will win?
I dislike being the last post, but I wanted to let you know... I read IT! Plus, it's a great opportunity to thank you for your patience today.
Thought I understood triples from my last go round. Apparently I didn't. I can assure you I do now. I won't ask again. Thanks for your help.
In the O/N, my guess the Weekly. But I'm not going to put money on it. Just playing along.
Have a great evening!
Thought I understood triples from my last go round. Apparently I didn't. I can assure you I do now. I won't ask again. Thanks for your help.
Originally posted by neoikon
I'm sure everyone is done for the day and no one will ever read this, but it seems the market is bouncing back and forth between the Weekly PP (1340.25) and the Monthly PP (1338).
Who will win?
In the O/N, my guess the Weekly. But I'm not going to put money on it. Just playing along.
Have a great evening!
[quote]Originally posted by Lisa P
15K by the time of this post
[LisaP,
hope all is well, haven't seen you for a couple of days.
Your interpretation of the size at 1333.00? (both columns I noticed)
If price dips below that 33 by a few ticks are you expecting liquidation of longs? Is that the standard interpretation?
thx /quote]
Paul9, it was more like a couple of weeks.... but who counts?
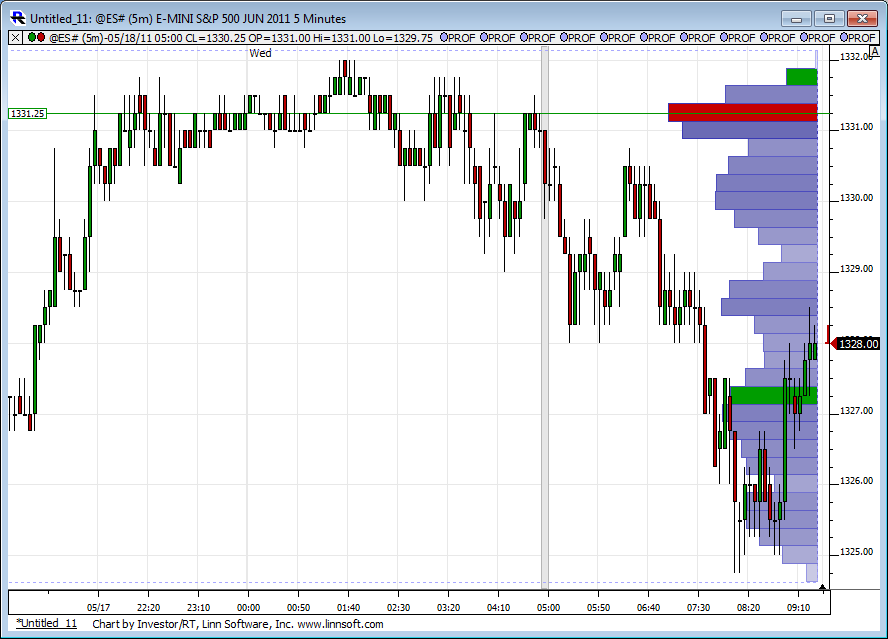
Regarding the above Footprint chart, please note that the last column shown on this chart is a "pullback" column. It shows the last 5-tic "layer" of the 4p column.
So the REAL last column is 4P, and the total number of the contracts entered at the price 1333.00 since the 4P column started was 15044. The number of contracts in the "pullback" column is only a part of the contracts shown in the 4P column. You can think of it as a paintbrush painting layers; each layer adds a coat of paint until the paintbrush moves.
As the price went up and down from 1332.50 to 1333.25, a large number of contracts quickly accumulated in the Pullback column at the price 1333.00. At the time of chart capture, that last layer showed that traders quickly entered 11,613 contracts at "ask" (large order by Mr. BigWig?), as compared with 4,332 contracts entered at "bid".
Buyers hitting "ask" price are sending their "market orders" to buy. Such a large order to buy drew my attention and I joined the party. Of course, what becomes of such effort is a different story... Many times the trade goes in this direction, but sometimes it is absorbed by an even larger party than Mr. BigWig. So I watch "live" action and make my decision.
In this case I almost immediately regretted entering the trade, as it was a long trade into a significant resistance. Even if these trades go, one would have to sit through a chop doubting the trade with every wonky move as Mr. BigWig "chews" through the resistance. So I exited my long trade with one point (4 tics)profit, and went out for lunch. As it happened, the trade did go up and made good money for Mr. BigWig, but freyed his nerves for an hour or more.
And that is my story. Please let me know if you need further clarification.
15K by the time of this post
Click image for original size

[LisaP,
hope all is well, haven't seen you for a couple of days.
Your interpretation of the size at 1333.00? (both columns I noticed)
If price dips below that 33 by a few ticks are you expecting liquidation of longs? Is that the standard interpretation?
thx /quote]
Paul9, it was more like a couple of weeks.... but who counts?
Regarding the above Footprint chart, please note that the last column shown on this chart is a "pullback" column. It shows the last 5-tic "layer" of the 4p column.
So the REAL last column is 4P, and the total number of the contracts entered at the price 1333.00 since the 4P column started was 15044. The number of contracts in the "pullback" column is only a part of the contracts shown in the 4P column. You can think of it as a paintbrush painting layers; each layer adds a coat of paint until the paintbrush moves.
As the price went up and down from 1332.50 to 1333.25, a large number of contracts quickly accumulated in the Pullback column at the price 1333.00. At the time of chart capture, that last layer showed that traders quickly entered 11,613 contracts at "ask" (large order by Mr. BigWig?), as compared with 4,332 contracts entered at "bid".
Buyers hitting "ask" price are sending their "market orders" to buy. Such a large order to buy drew my attention and I joined the party. Of course, what becomes of such effort is a different story... Many times the trade goes in this direction, but sometimes it is absorbed by an even larger party than Mr. BigWig. So I watch "live" action and make my decision.
In this case I almost immediately regretted entering the trade, as it was a long trade into a significant resistance. Even if these trades go, one would have to sit through a chop doubting the trade with every wonky move as Mr. BigWig "chews" through the resistance. So I exited my long trade with one point (4 tics)profit, and went out for lunch. As it happened, the trade did go up and made good money for Mr. BigWig, but freyed his nerves for an hour or more.
And that is my story. Please let me know if you need further clarification.
Originally posted by BruceM
Lisa,
I had suggested on another day trading thread that you might want to make some videos of how u read the footprint..This way those who don't do the skype thing can still benefit from your knowledge....any interest on your part?
Might be very useful....and just so everyone reading is aware, Lisa has been very generous to offer skype for those looking for footprint awareness...
Bruce, sorry I obviously missed your previous request to record a Footprint chart action, as I missed your post today. Of course, that is the problem with these threads - any conversation takes days with participants missing key pieces. And that is why I suggested a Skype session for the interested traders.
After you posted your short video I tried to record one too, but was unsuccessful. I do not have a good video recording program. The one I looked at, Jing, only allows for 5-min of recording. This was not long enough, as at the time of recording market chopped longer than 5 minutes without an event and the video was quite boring. When there IS an event, I would like to trade instead of screwing around with the video and comments. It just took too much time, as you found out recording and re-recording, and the quality was poor.
I previously tried to explain the Footprint chart several times on the thread, but it is tough to do - not too many people were interested, took too much time to write, I only answer the questions people ask and every new person is going to ask the same questions. The explanation I provided in the past were pretty detailed, but who can find them now? That is the problem with the ocasional posts or even a video.
In short, I still prefer a Skype session for those who are interested. Participants can capture key points in the "minutes" and post them on the thread afterwards. The main advantage of a Skype session is that it is interactive and people can get their questions answered (to the best of my knowledge)right away and generate further questions.
I will be happy do a Skype session either after close or in the evening. I can either do a joint session or individual sessions with interested traders.
Originally posted by BruceM
it seems to me that the real key to all this footprint stuff is figuring out when heavy ask volume is REALLY buying and when heavy bid volume is REALLY selling.....
It seems to lack a filter to really help us figure that crucial question out..
I see heavy Bid volume at 34.75 but it is not selling off...but by the time you figure that out the market is 1.75 - 2 points higher...
Bruce, it is a bitch! Tha is what trading long at resistance is like.
But I am not going to write another long answer. Skype me...lol.
Emini Day Trading /
Daily Notes /
Forecast /
Economic Events /
Search /
Terms and Conditions /
Disclaimer /
Books /
Online Books /
Site Map /
Contact /
Privacy Policy /
Links /
About /
Day Trading Forum /
Investment Calculators /
Pivot Point Calculator /
Market Profile Generator /
Fibonacci Calculator /
Mailing List /
Advertise Here /
Articles /
Financial Terms /
Brokers /
Software /
Holidays /
Stock Split Calendar /
Mortgage Calculator /
Donate
Copyright © 2004-2023, MyPivots. All rights reserved.
Copyright © 2004-2023, MyPivots. All rights reserved.