ES 5-18-2011
10:30 report and still not rejecting YD highs...trying to get initial target at 28.25////
here is the hour highs too...adding at 31.50
that add was lighter as they know stops sit above the 1332 highs.....so big volume will blow throughthat and run everyone out.....Including me...or they will fail that breakout and bring it back down...
This is not looking like a great fade as $ticks are improving withj A/D
This is not looking like a great fade as $ticks are improving withj A/D
50% of RTH weekly range (current week) = 1328.63
RTH had test of 28, retrace, found support, now exceed.
a move above 32.75 (3 ticks above AH H for noise) can trap bears short (I think), could produce another 3 pts in a hurry.
RTH had test of 28, retrace, found support, now exceed.
a move above 32.75 (3 ticks above AH H for noise) can trap bears short (I think), could produce another 3 pts in a hurry.
right now, prints above 32.75 have not unlocked volume.
Ok official add is 1333 ...I still treat this as only 2 parts to the campaign....and now initial target becomes the hour highs...need market to get back below 1332
3 - 30 minute bars up and single prints below if we closed right now..
3 - 30 minute bars up and single prints below if we closed right now..
if we look at $ticks and volume relative to Yesterday only we have a poor rally so far.....but I've also seen "poor" rallies that keep going up...we'll see, I believe that they will start consolidating this soon...and not specifically have a big selloff...so the hour high is still a decent target
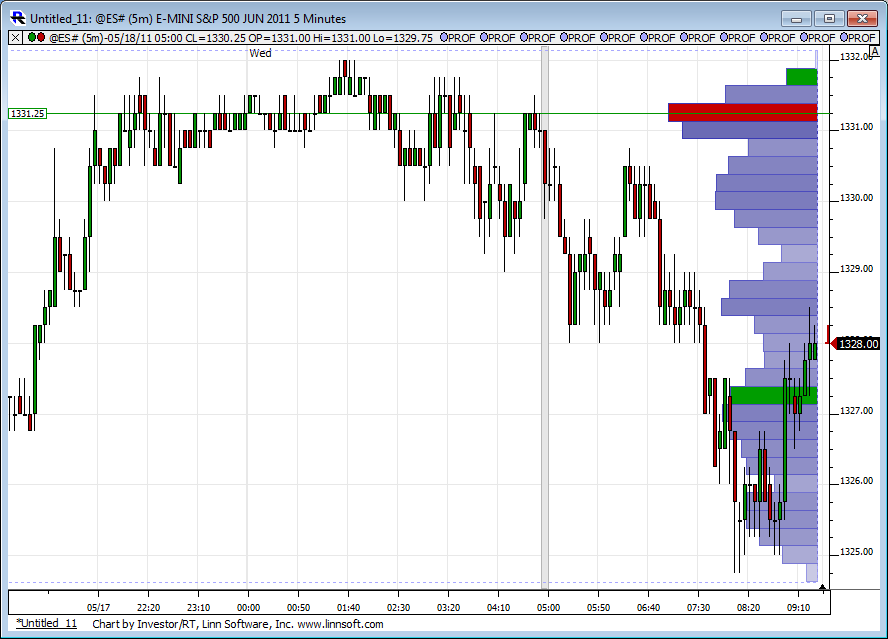
Here is a look at relative volume and as Bruce points out....low.
Click image for original size

Originally posted by BruceM
if we look at $ticks and volume relative to Yesterday only we have a poor rally so far.....but I've also seen "poor" rallies that keep going up...we'll see, I believe that they will start consolidating this soon...and not specifically have a big selloff...so the hour high is still a decent target
final add for me will be at 34.50 If it prints...not convinced it is coming...but that is the plan....trade up to 37 area will force me to close this out..ideal situation is two fold....
a 90 minute close below 1332 or an attempted break of the 90 minute high that lacks follow through...
a 90 minute close below 1332 or an attempted break of the 90 minute high that lacks follow through...
Not really impressive.
I like to see the NQ lead, and it hasn't even been able to get above the AH H of 48.50.
even though the ES is above it's H.
This same pattern unfolded On Monday, and prices ultimately went down.
On Monday, NQ could not get above it's overnight H even though the ES was printing 7 points ABOVE it's overnight H.
Originally posted by BruceM
it seems to me that the real key to all this footprint stuff is figuring out when heavy ask volume is REALLY buying and when heavy bid volume is REALLY selling.....
It seems to lack a filter to really help us figure that crucial question out..
I see heavy Bid volume at 34.75 but it is not selling off...but by the time you figure that out the market is 1.75 - 2 points higher...
Bruce, it is a bitch! Tha is what trading long at resistance is like.
But I am not going to write another long answer. Skype me...lol.
Emini Day Trading /
Daily Notes /
Forecast /
Economic Events /
Search /
Terms and Conditions /
Disclaimer /
Books /
Online Books /
Site Map /
Contact /
Privacy Policy /
Links /
About /
Day Trading Forum /
Investment Calculators /
Pivot Point Calculator /
Market Profile Generator /
Fibonacci Calculator /
Mailing List /
Advertise Here /
Articles /
Financial Terms /
Brokers /
Software /
Holidays /
Stock Split Calendar /
Mortgage Calculator /
Donate
Copyright © 2004-2023, MyPivots. All rights reserved.
Copyright © 2004-2023, MyPivots. All rights reserved.