ES Day Trading 5-23-2011
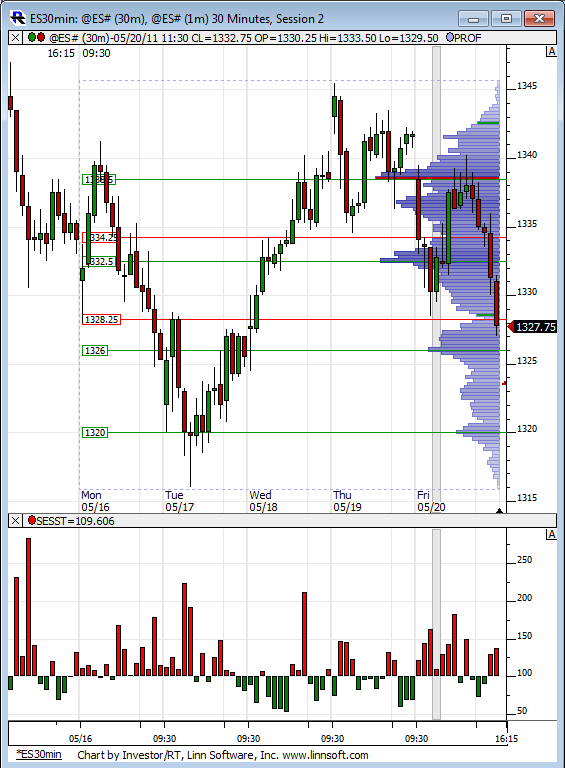
Volume Profile for last weeks RTH action. Not much volume relatively speaking at the bottom of the range.
Click image for original size
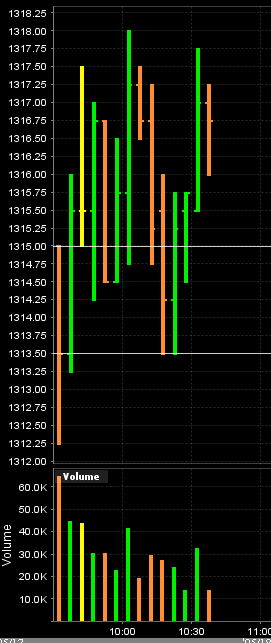
here is how all my rhetoric looks like.....the horizontal lines are the opening range- 1313.50 - 1315...that is the first one minute range ...Was watching that closely as a break of that low would have put us below the 15 volume node and the OR lows....
still runners can't even get new highs...we need to be careful if we get back below the OR lows..that would put us below the open ( opening range) and volume node in the 15 area...in theory that should get us to break the 60 minute lows and O/N low...
I'm currently trading for the opposite...so I want the 60 minute highs and the O/N high...hope that filter system makes sense..now lets hope it makes money $$$$$$$$$$
Click image for original size
Well here is a look at VWAP and CD action. Obvious O/N low defense but as of right now VWAP is resistance and CD shows pushing failures so far.
But clearly range bound action at the moment. Paul's box should get broken sooner or later.
But clearly range bound action at the moment. Paul's box should get broken sooner or later.
Click image for original size
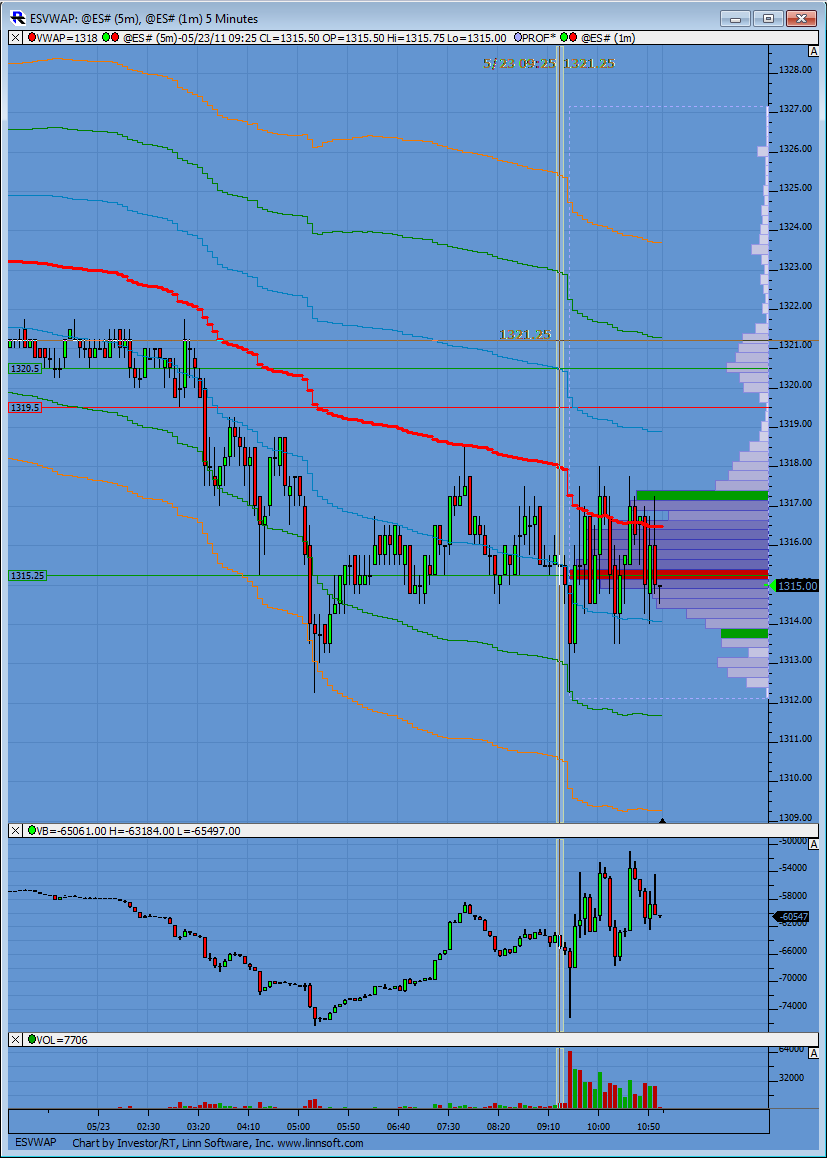
I really would like to see a close on 30 minute back inside last weeks RTH range...can't do it which is a bad sign so far for longs...on flip side we can't get a 30 minute close below the OR either.....we are all confused!!
let's see where the 11:30 comes in.....coiling tight....should have some trend soon..
let's see where the 11:30 comes in.....coiling tight....should have some trend soon..
long off 12.50 on the way back up...not finding sellers under O/N low now...
taking 3 off at 14.50 and holding two...failure at those lows will try for midrange and the opposite range....so tryingto hold for 60 minute highs....don't want to see 12.50 again
14.50 - 15.25 is now critical...15.50 is peak volume and we ssem to be symetric
VWAP is in a well defined down trend which so far has kept prices in check as resistance. However, prices haven't tried to break away from VWAP in any considerable fashion either. A clear struggle here and most likely, since we are below last weeks lows, there is some kind of rotation happening amongst the big money and when one side wins price will move away from this area.
Bruce,
Do you believe it could go to 1319.50?
Do you believe it could go to 1319.50?
To BruceM
$ticks still showing more clusters above zero so long is still my preferred direction
I just noticed your post from 10:30 AM I was wondering if you use the $VOLD and the $ADD to show you the market direction . As far as those 2 symbol showed at 10:30 AM the market was and still is going down why if at all you ignore those symbols your response is very important for me I want to understand your analysis
Financials playing the extra two hours sold 2 pm Friday. Watching the pit open at 7:20 AM CST and the close at 2 sets the scene for the contained ORBO IB cash open. Price opened below the six month average this morning and the direction of the price break before ranges widen changed. I anticipate chop here in ES, from 12 to 21, back down, tightening, to 35 and then a confirmed bear on new lows.
The six year average scaled in a 240 suggests the same play.
The six year average scaled in a 240 suggests the same play.
thanks....we closed one tic off the midpoint.....neutral days..!
Emini Day Trading /
Daily Notes /
Forecast /
Economic Events /
Search /
Terms and Conditions /
Disclaimer /
Books /
Online Books /
Site Map /
Contact /
Privacy Policy /
Links /
About /
Day Trading Forum /
Investment Calculators /
Pivot Point Calculator /
Market Profile Generator /
Fibonacci Calculator /
Mailing List /
Advertise Here /
Articles /
Financial Terms /
Brokers /
Software /
Holidays /
Stock Split Calendar /
Mortgage Calculator /
Donate
Copyright © 2004-2023, MyPivots. All rights reserved.
Copyright © 2004-2023, MyPivots. All rights reserved.