ES Day Trading 5-23-2011
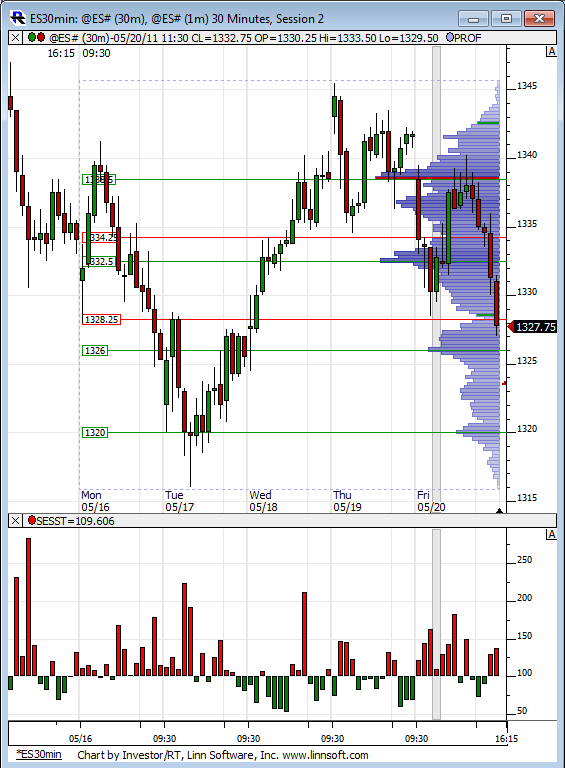
Volume Profile for last weeks RTH action. Not much volume relatively speaking at the bottom of the range.
Click image for original size
yes I do but we obviously need to hold trade above the lows of the Overnight which is also the 60 minute RTH low
Originally posted by johnpr2010
Bruce,
Do you believe it could go to 1319.50?
I don't use them but i think they could be useful....I'm a fader so they may help to spot divergences but haven't spent enough time analyzing them...I do look at the adv - dec volume and issues at 1/2 hour intervals.....but only as a broad measure....not in the traditional sense
Originally posted by khamore1
To BruceM
$ticks still showing more clusters above zero so long is still my preferred direction
I just noticed your post from 10:30 AM I was wondering if you use the $VOLD and the $ADD to show you the market direction . As far as those 2 symbol showed at 10:30 AM the market was and still is going down why if at all you ignore those symbols your response is very important for me I want to understand your analysis
To BruceM
I want to thank you for your last response I have a follow up question for you
What intervals do you use on the $TICK do you constantly monitor that symbole?
I want to thank you for your last response I have a follow up question for you
What intervals do you use on the $TICK do you constantly monitor that symbole?
1900 hundred decliners over advancers...seems a bit excessive on a day that really hasn't trended in RTH...
but everything in context, there will come a point that either all the gap fill faders give up and we have an atomic dump or the selloff traders give up and we rally hard
a 30 minute close below the 60 minute lows may be a clue....non have happened yet today ....we'll see
but everything in context, there will come a point that either all the gap fill faders give up and we have an atomic dump or the selloff traders give up and we rally hard
a 30 minute close below the 60 minute lows may be a clue....non have happened yet today ....we'll see
Originally posted by BruceM
a 30 minute close below the 60 minute lows may be a clue....non have happened yet today ....we'll see
That's been what I'm waiting for, down to 1300?
Quote of the day.
Trading is a business and, as such, must always adapt to changing market conditions.
-Brett Steenbarger
Trading is a business and, as such, must always adapt to changing market conditions.
-Brett Steenbarger
If we go neutral ( trade above 60 minute highs ) I will take one off and try to hold last.....one of two things SHOULD happen on Neutral days in general,,,,close at extremes or in the middle...I won't go short but will use any lack of buying to exit last contract..
still would like to see a 30 minute close inside last weeks RTH lows....us longs are not safe yet...the battle still rages..
still would like to see a 30 minute close inside last weeks RTH lows....us longs are not safe yet...the battle still rages..
The $tick and I have a bipolar relationship...LOL....I don't use any indicators on it and it seems to be losing it's lustre for me..
I am working on a relative volume Indicator ( not really an indicator) with Lorns help in Market Delta.....it shows promise but I still need to see it as a histogram....If anyone has any minor programming skills or MD experience then perhaps you could help us out...not sure if it will net out as any great thing but we'll see...
I think the Cummulative $ tick with cummulative delta would be a good combo as per Dr. Brett...it makes logical sense and then bring in the volume component as the final key..and we always have price and ranges...these other things will always be secondary to me to price
Originally posted by khamore1
To BruceM
I want to thank you for your last response I have a follow up question for you
What intervals do you use on the $TICK do you constantly monitor that symbole?
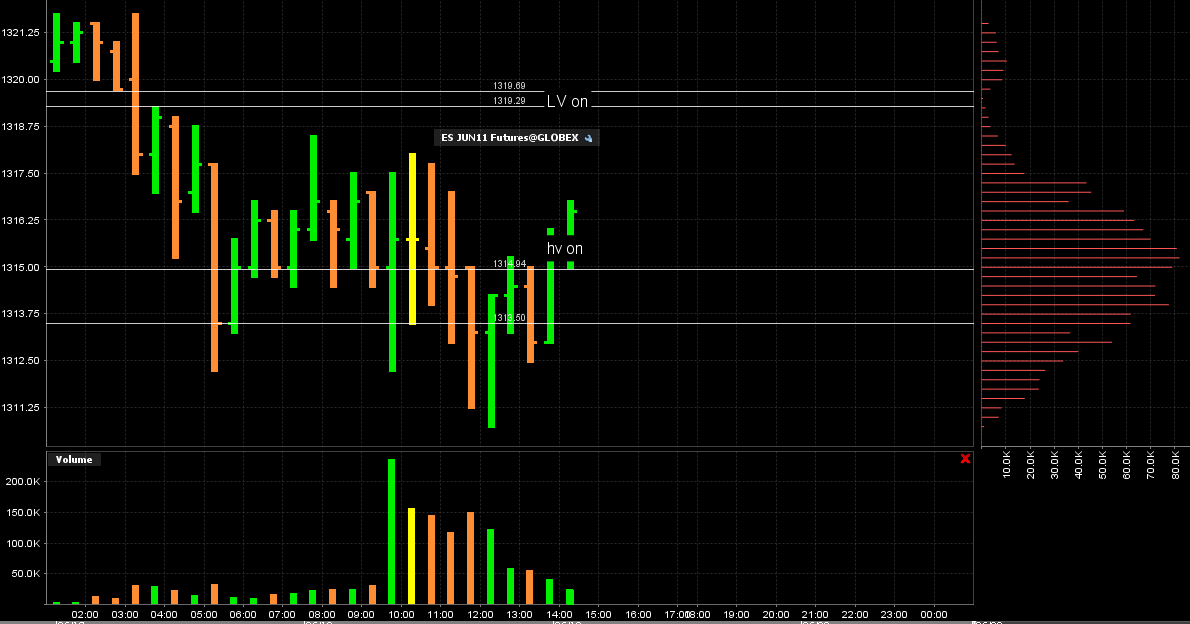
a look at the low volume ( single prints area)I've been eyeing all day....that is a key area..up at the 19 area
Click image for original size
Originally posted by Big Mike
Originally posted by BruceM
a 30 minute close below the 60 minute lows may be a clue....non have happened yet today ....we'll see
That's been what I'm waiting for, down to 1300?
30m close abov 18.50 (6:00 am swing high) negates short and continuation will begin long, 1st target 22, 2nd target 26.
thanks....we closed one tic off the midpoint.....neutral days..!
Emini Day Trading /
Daily Notes /
Forecast /
Economic Events /
Search /
Terms and Conditions /
Disclaimer /
Books /
Online Books /
Site Map /
Contact /
Privacy Policy /
Links /
About /
Day Trading Forum /
Investment Calculators /
Pivot Point Calculator /
Market Profile Generator /
Fibonacci Calculator /
Mailing List /
Advertise Here /
Articles /
Financial Terms /
Brokers /
Software /
Holidays /
Stock Split Calendar /
Mortgage Calculator /
Donate
Copyright © 2004-2023, MyPivots. All rights reserved.
Copyright © 2004-2023, MyPivots. All rights reserved.