ES 6-3-2011
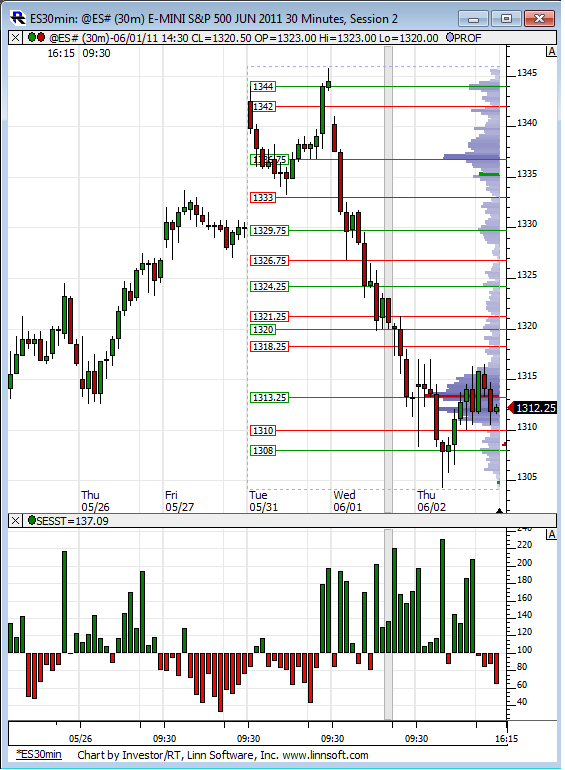
Putting this guy up before the big news out at 8:30. As Bruce pointed out yesterday 1313 zone is an important inflection point.
Click image for original size
Click image for original size

...courtesy Bespoke.
Originally posted by BruceM
The charts always look great after we hit an area but I could probably make a fib area at every swing point on a chart...
If I may add my 2 cents. I completely agree and it's a frustration of mine when I've done my own fib analysis. Which points do I take the measurement from? Which retracement will matter and which won't? If you draw enough lines, at least one will hit! Thus, my methods are typically not quite the norm as I try and solve those problems.
For example, assuming someone believes in pivot levels (which I'm assuming at least some do, since this IS mypivots.com). Then there is no guesswork as to where those levels are for a given day. Thus, using those as fixed levels to take measurements from, there is no guesswork as to where those fib levels are (except looking/knowing the direction the market is moving).
I've mentioned a few times before looking at the the 52.8% and 78.6% between the pivot levels. As we crossed through S2 and headed toward S3, the 52.8% level is 94.75, 1T off our low so far.
Otherwise, as we go from S2 to S1, 52.8 is at 1301.75... 78.6, 1303.75. Though, just to note, I think of those as more of targets, than reversal points.
Just my opinion... Daniel
And from sentimentrader..."Generally, the market follows a contrary manner when it comes to the Payroll Report - a big, positive surprise and large gap up opening in stocks tends to lead to poor performance going forward, and vice-versa.
So those looking for a multi-day rebound in stocks would probably, in a twisted kind of way, be best served by seeing a large negative surprise and gap down. While that may violate technical support in many indexes, a stab below then trade back above support would have the best chance for a more sustainable rally."
So those looking for a multi-day rebound in stocks would probably, in a twisted kind of way, be best served by seeing a large negative surprise and gap down. While that may violate technical support in many indexes, a stab below then trade back above support would have the best chance for a more sustainable rally."
daniel, where do u have s2 and s3? i have 1298 and 1284.5, so 52.8 when we cross s2 towards s3 would be 1290.8...
we seem to agree on the targets within the s1-s2 pair though
we seem to agree on the targets within the s1-s2 pair though
Originally posted by neoikon
Originally posted by BruceM
The charts always look great after we hit an area but I could probably make a fib area at every swing point on a chart...
If I may add my 2 cents. I completely agree and it's a frustration of mine when I've done my own fib analysis. Which points do I take the measurement from? Which retracement will matter and which won't? If you draw enough lines, at least one will hit! Thus, my methods are typically not quite the norm as I try and solve those problems.
For example, assuming someone believes in pivot levels (which I'm assuming at least some do, since this IS mypivots.com). Then there is no guesswork as to where those levels are for a given day. Thus, using those as fixed levels to take measurements from, there is no guesswork as to where those fib levels are (except looking/knowing the direction the market is moving).
I've mentioned a few times before looking at the the 52.8% and 78.6% between the pivot levels. As we crossed through S2 and headed toward S3, the 52.8% level is 94.75, 1T off our low so far.
Otherwise, as we go from S2 to S1, 52.8 is at 1301.75... 78.6, 1303.75. Though, just to note, I think of those as more of targets, than reversal points.
Just my opinion... Daniel
@ Kooblue
I love you comments realy...greatgreat Job !!! Thank you so much.....
I love you comments realy...greatgreat Job !!! Thank you so much.....
Originally posted by NickP
daniel, where do u have s2 and s3? i have 1298 and 1284.5, so 52.8 when we cross s2 towards s3 would be 1290.8...
Short answer 1291.75.
Long answer...
I use what is referred to as "floor" pivots. They are the same as "classic" except for S3+ and R3+.
Basically, they are half the distance as the "classic" when you get to S3/R3 and further.
Classic S3: PP-(H-L)*2 = 1284.50 (as you mention)
Floor S3: L-2*(H-PP) = 1291.75
Daniel
No one shorted at 1302 and change after 1000 EST?
Originally posted by neoikon
[quote]Originally posted by BruceM
Otherwise, as we go from S2 to S1, 52.8 is at 1301.75... 78.6, 1303.75. Though, just to note, I think of those as more of targets, than reversal points.
News gave us a pop up to that 1303.75 area (2T from that 78.6), which it seems to be respecting.
For me, when I use those two levels as targets, I front-run the 52.8 by 2T and 78.6 by 4T, just to increase my chances of getting a fill, be more conservative (i.e. not too greedy). So with that, I'm flat... not to say it won't go higher...
Daniel
got it, thanks
Originally posted by neoikon
Originally posted by NickP
daniel, where do u have s2 and s3? i have 1298 and 1284.5, so 52.8 when we cross s2 towards s3 would be 1290.8...
Short answer 1291.75.
Long answer...
I use what is referred to as "floor" pivots. They are the same as "classic" except for S3+ and R3+.
Basically, they are half the distance as the "classic" when you get to S3/R3 and further.
Classic S3: PP-(H-L)*2 = 1284.50 (as you mention)
Floor S3: L-2*(H-PP) = 1291.75
Daniel
Originally posted by NickP
daniel, where do u have s2 and s3? i have 1298 and 1284.5, so 52.8 when we cross s2 towards s3 would be 1290.8...
Oh yeah, and my S2 is the same as yours... 1298.
Last trade of the day for me was shorting at 1308 at 1050 EST. Not knowing what to expect and not even sure why we were even that high again to begin with I elected to exit quickly at 1306.50. I still had thoughts that we could go lower but dismissed those so I could go to bed.
Woke up this AM to see we closed at 1295.75!
Perhaps it is better this way. Two profitable 12 point plus trades in one day is still a pipe dream for me. One such trade a few much smaller trades is what I will settle for for now.
Woke up this AM to see we closed at 1295.75!
Perhaps it is better this way. Two profitable 12 point plus trades in one day is still a pipe dream for me. One such trade a few much smaller trades is what I will settle for for now.
Emini Day Trading /
Daily Notes /
Forecast /
Economic Events /
Search /
Terms and Conditions /
Disclaimer /
Books /
Online Books /
Site Map /
Contact /
Privacy Policy /
Links /
About /
Day Trading Forum /
Investment Calculators /
Pivot Point Calculator /
Market Profile Generator /
Fibonacci Calculator /
Mailing List /
Advertise Here /
Articles /
Financial Terms /
Brokers /
Software /
Holidays /
Stock Split Calendar /
Mortgage Calculator /
Donate
Copyright © 2004-2023, MyPivots. All rights reserved.
Copyright © 2004-2023, MyPivots. All rights reserved.