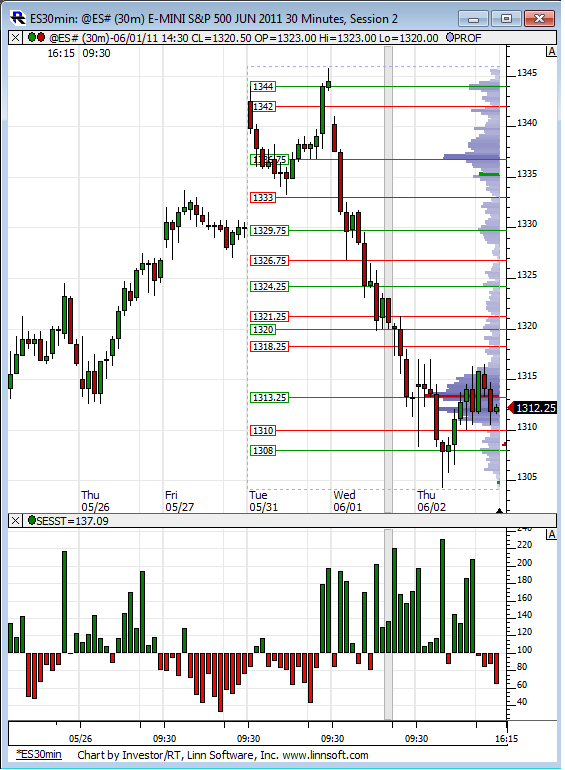
ES 6-3-2011
Putting this guy up before the big news out at 8:30. As Bruce pointed out yesterday 1313 zone is an important inflection point.
Click image for original size
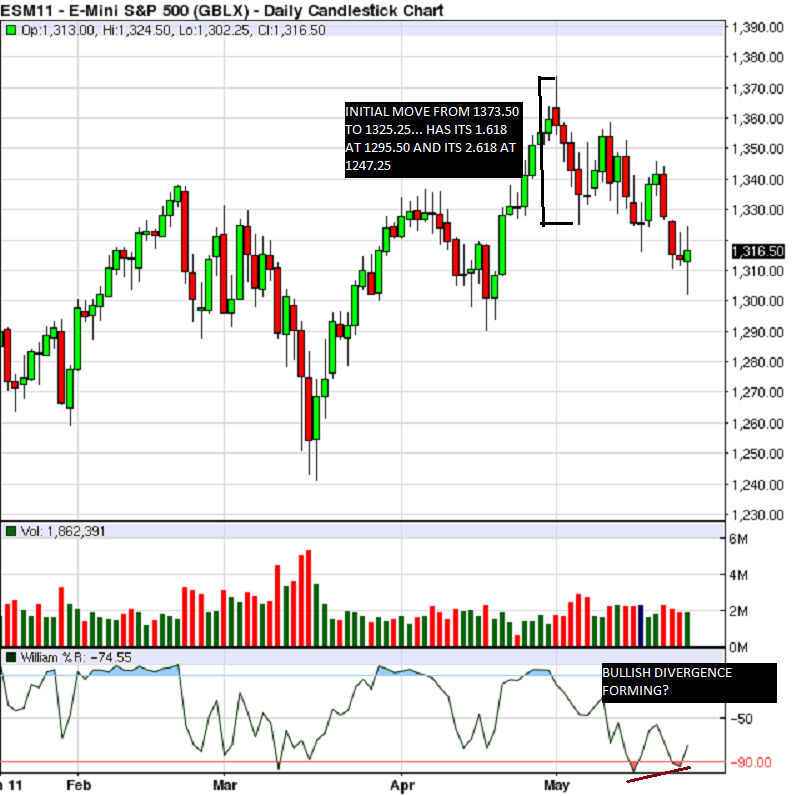
First shown WEEKS ago...then most recently on 5/27....
Click image for original size
yep, great call kool
John, can you or anyone help me remove the subjectivity of fib lines....? been trying for years....we can find points and reaction points everywhere so how specifically do we find the point to measure form that is consistent...?
The charts always look great after we hit an area but I could probably make a fib area at every swing point on a chart...
I'm not trying to be rude, I'm just looking for clarity..
Thanks
and well done Iceland !!
The charts always look great after we hit an area but I could probably make a fib area at every swing point on a chart...
I'm not trying to be rude, I'm just looking for clarity..
Thanks
and well done Iceland !!
ideal longs for me will be near 92 ...hoping to add to this in day session only...for now I'm just waiting......report at 10 am
everything will be scaled back for me until that report hits...
nothing worse for me then getting a beating on a friday...I just hate waiting over the weekend to get back in the market
96.50 is trying to establish a new volume node down here and will be a key area
everything will be scaled back for me until that report hits...
nothing worse for me then getting a beating on a friday...I just hate waiting over the weekend to get back in the market
96.50 is trying to establish a new volume node down here and will be a key area
Bruce,
I use a couple of swings measure and use the ones that confluence with each other looking for to different levels to mach one specific number or avg number. Ej. On my recent chart posted you can see 2 different fibs levels matching at one average number. That gives me confidence that could be a good level to scalp the market for a couple of points.
I use a couple of swings measure and use the ones that confluence with each other looking for to different levels to mach one specific number or avg number. Ej. On my recent chart posted you can see 2 different fibs levels matching at one average number. That gives me confidence that could be a good level to scalp the market for a couple of points.
Originally posted by BruceM
John, can you or anyone help me remove the subjectivity of fib lines....? been trying for years....we can find points and reaction points everywhere so how specifically do we find the point to measure form that is consistent...?
The charts always look great after we hit an area but I could probably make a fib area at every swing point on a chart...
I'm not trying to be rude, I'm just looking for clarity..
Thanks
and well done Iceland !!
O/N action. Volume at the top of the range and volume at the bottom of the range.
Click image for original size
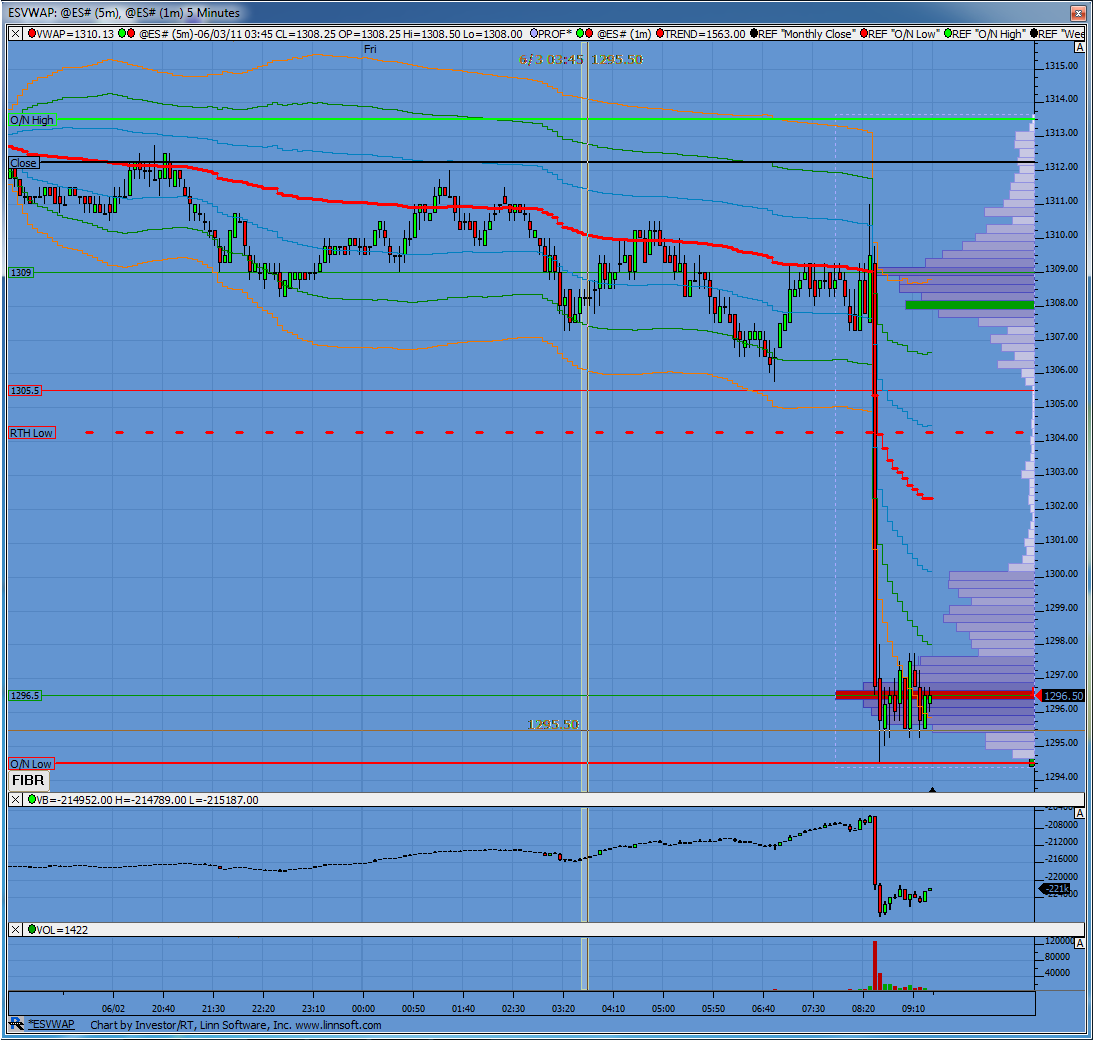
air pocket from O/N session begins at 1300.25 and runs all the way up to 1306....I think we have good odds of getting into that pocket...and it really doesn't matter how far...as long as we print 1300.50 then they will have at least tested it...
I also follow cycles within the day.
I'm showing times of 1000 , 1200 and 1430 hrs EST.
Interesting that the 1000 EST corresponds with the report. That will be my next focus for today as the others are too late.
Note that by cycles I'm not looking at ups/downs. I'm looking for ideal times of increased "activity" where it makes sense to enter a trade. For this type of trade I look for 3 things: the cycle time, key support/resistance, and a variation of Market Profile / Market Delta for the buy vs sell decision.
just covered 6 longs from 1295.50 at 1298.50, keeping 2 runners (with a 1294.00 stop) looking for the " normal' up all day pattern to play out...
how cool is that....the air and 1300 become a strong magnet..
holding one runner to see if I can get 1303....otherwise I'll stop out at 97..
good structure so far
holding one runner to see if I can get 1303....otherwise I'll stop out at 97..
good structure so far
Last trade of the day for me was shorting at 1308 at 1050 EST. Not knowing what to expect and not even sure why we were even that high again to begin with I elected to exit quickly at 1306.50. I still had thoughts that we could go lower but dismissed those so I could go to bed.
Woke up this AM to see we closed at 1295.75!
Perhaps it is better this way. Two profitable 12 point plus trades in one day is still a pipe dream for me. One such trade a few much smaller trades is what I will settle for for now.
Woke up this AM to see we closed at 1295.75!
Perhaps it is better this way. Two profitable 12 point plus trades in one day is still a pipe dream for me. One such trade a few much smaller trades is what I will settle for for now.
Emini Day Trading /
Daily Notes /
Forecast /
Economic Events /
Search /
Terms and Conditions /
Disclaimer /
Books /
Online Books /
Site Map /
Contact /
Privacy Policy /
Links /
About /
Day Trading Forum /
Investment Calculators /
Pivot Point Calculator /
Market Profile Generator /
Fibonacci Calculator /
Mailing List /
Advertise Here /
Articles /
Financial Terms /
Brokers /
Software /
Holidays /
Stock Split Calendar /
Mortgage Calculator /
Donate
Copyright © 2004-2023, MyPivots. All rights reserved.
Copyright © 2004-2023, MyPivots. All rights reserved.