ES Monday 7-18-11
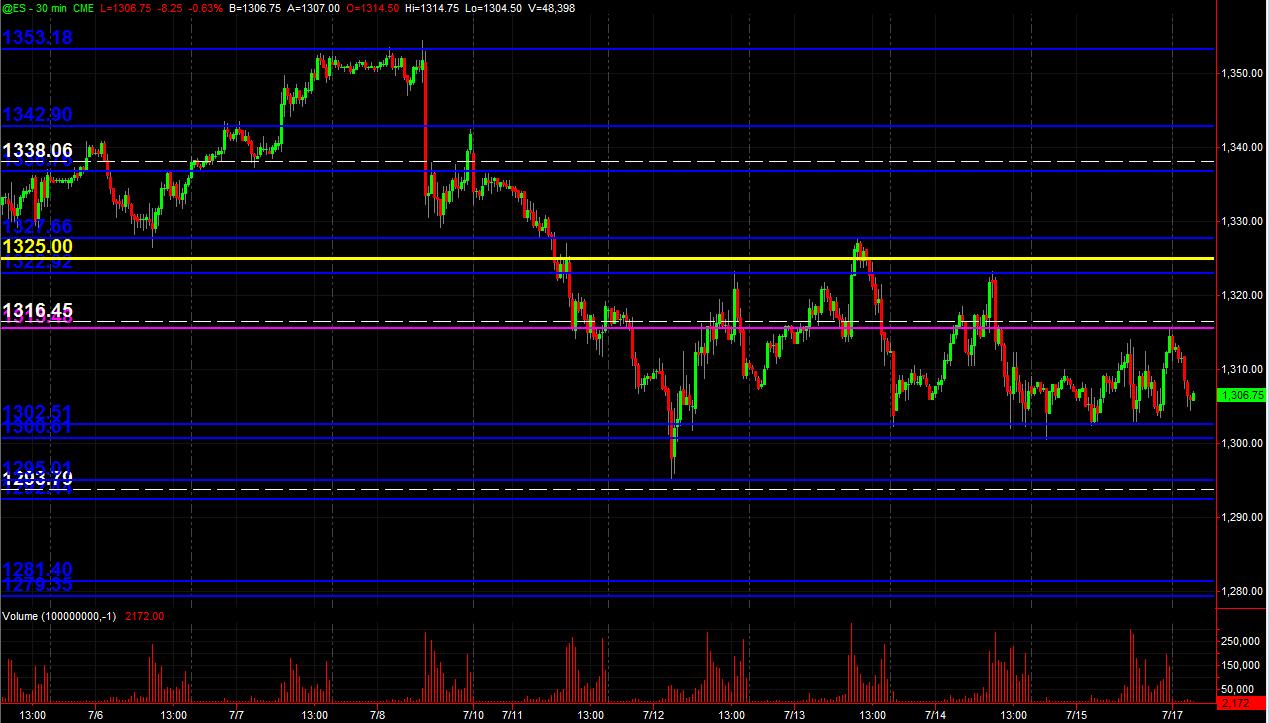
Thought I'd post my "map" of the ES 30min chart with potential significant PASR levels that I have in Blue (any in Magenta are semi-significant). The Dashed White lines are the Wkly Pvts. Also, have a Yellow line that is a Fib cluster fwiw.
Whether trading equities or ES ... hope this is helpful.
And any/everyone post your analysis with rationale for what you're seeing coming into Monday's trading session.
Click image for original size
Whether trading equities or ES ... hope this is helpful.
And any/everyone post your analysis with rationale for what you're seeing coming into Monday's trading session.
poc as per time sits near 97.50 so that is the tricky part IF longs are to really make something happen
if anyone wants to view the thread in the "old" style,
just go to your profile page (edit profile) you will need your password.
bottom of edit profile page (the very bottom) on the left hand side says 'flow' you can click on that and opt for 'Classic' submit
viola back to the old familiar.
just go to your profile page (edit profile) you will need your password.
bottom of edit profile page (the very bottom) on the left hand side says 'flow' you can click on that and opt for 'Classic' submit
viola back to the old familiar.
Bruce,
if Price moved into the LVN just above 1300 (from today, 24hour chart 5min) would be a buyer or a seller.
I see that it's single prints too.
would you be selling on the first test of that zone?
if Price moved into the LVN just above 1300 (from today, 24hour chart 5min) would be a buyer or a seller.
I see that it's single prints too.
would you be selling on the first test of that zone?
Hi Bruce on your market profile what time frame are you in ??
Originally posted by PAUL9
Bruce,
if Price moved into the LVN just above 1300 (from today, 24hour chart 5min) would be a buyer or a seller.
I see that it's single prints too.
would you be selling on the first test of that zone?
Paul...the old Bruce would be trying sells inside that zone blindly.....the new improved Bruce will look for something to happen inside there with the footprint as a filter....but the best SELLS regardless will come from above 1301.25.......as the folks who blindly sell inside that LVN cover when they realize it isn't dropping fast enough for them...so their buying back leads to price spiking up.....so when their buying is over you see retests of that LVN zone from ABOVE and price tends to spend a bit of time filling in the extremes...much like you see price filling the 94 area right now...that was a single print break down point earlier .. I'm crrently holding longs to get into that above area u mentioned and I want to see them reject that 94 area and move it UP....the point is that you can see how that 94 air pocket beocmes an attractor and price is jerking around at that now.....the same thing may happen up near 1301.25 if they can start a rally
Hopefully that makes sense..I know what I mean but I'm not sure if I am articulating that well
Hopefully that makes sense..I know what I mean but I'm not sure if I am articulating that well
East coast Della
it 's important to remember that just because we don't get an official Single print as defined by Market profile and 30 minute bars it doesn't mean that they don't exist based on volume alone....this is where the traditional MP players miss out out on some of the other clues that volume alone provides
Thats cool so you are using the 30 minute chart for the market files is that rite??
Richard
Richard
Originally posted by BruceM
it 's important to remember that just because we don't get an official Single print as defined by Market profile and 30 minute bars it doesn't mean that they don't exist based on volume alone....this is where the traditional MP players miss out out on some of the other clues that volume alone provides
THX, Bruce,
really terrific explanations. I always find it easier to latch onto an observation when I can have an insight into the motivation for the PA.
really terrific explanations. I always find it easier to latch onto an observation when I can have an insight into the motivation for the PA.

Originally posted by day trading
[quote]Originally posted by PAUL9
We are adding new features to the Flow format but not doing any work on the old format.
DT, thanks for the imrovements. It would be great to add an automatic return to the bottom of the page after update, instead of the top of the page.
Keep up the good work.
Emini Day Trading /
Daily Notes /
Forecast /
Economic Events /
Search /
Terms and Conditions /
Disclaimer /
Books /
Online Books /
Site Map /
Contact /
Privacy Policy /
Links /
About /
Day Trading Forum /
Investment Calculators /
Pivot Point Calculator /
Market Profile Generator /
Fibonacci Calculator /
Mailing List /
Advertise Here /
Articles /
Financial Terms /
Brokers /
Software /
Holidays /
Stock Split Calendar /
Mortgage Calculator /
Donate
Copyright © 2004-2023, MyPivots. All rights reserved.
Copyright © 2004-2023, MyPivots. All rights reserved.