JI
jimkane
Rep: 3,058
Posts: 33,089
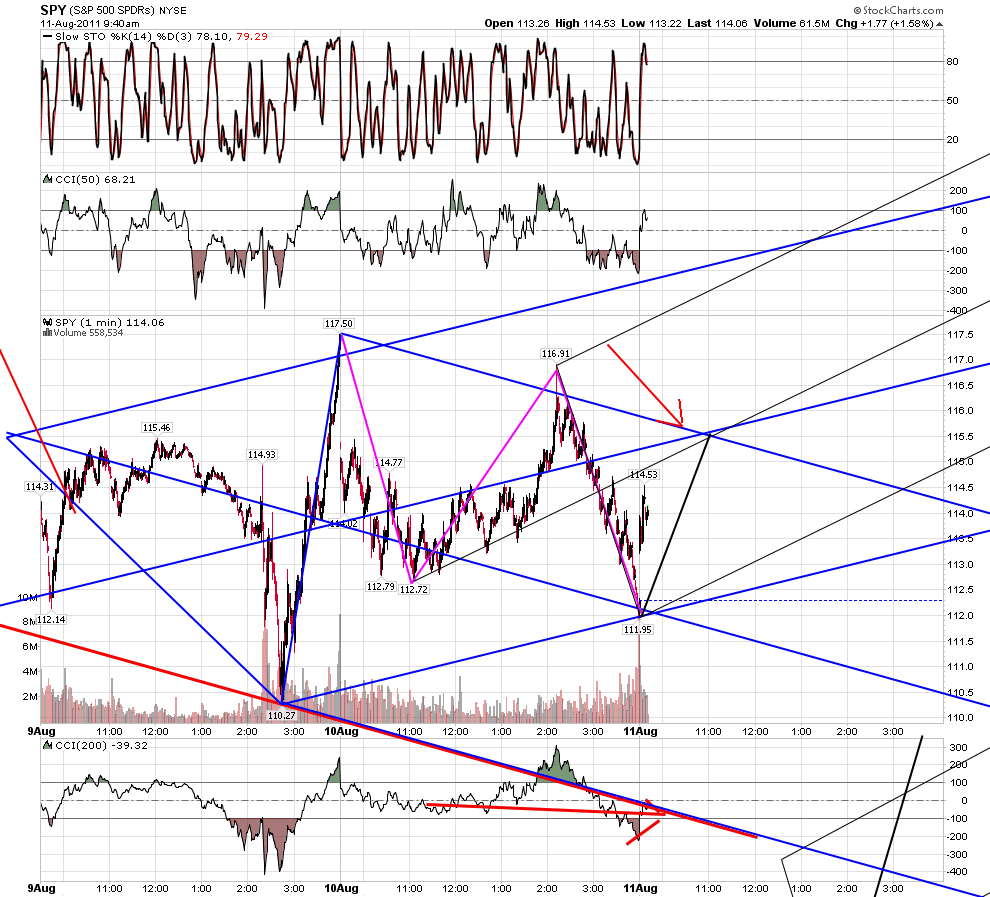
T minus 5 minutes and counting... But we already have some indications from the spot FX market.
RO
roofer
Rep: 3,689
Posts: 3,574
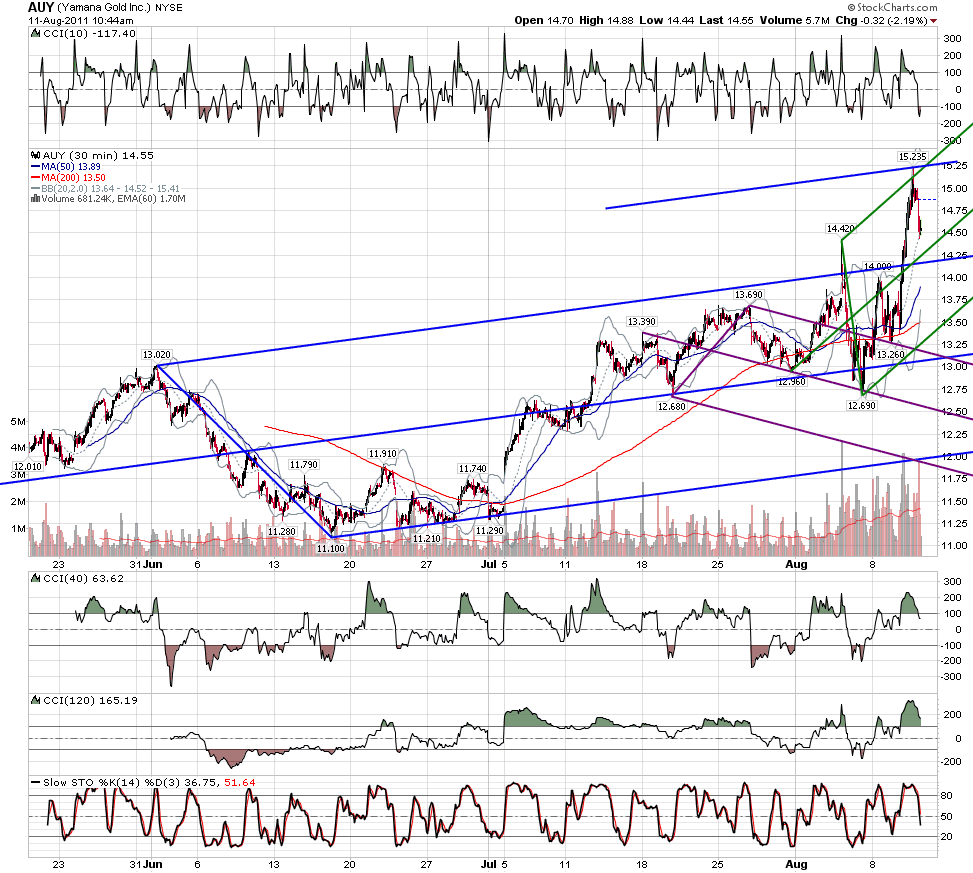
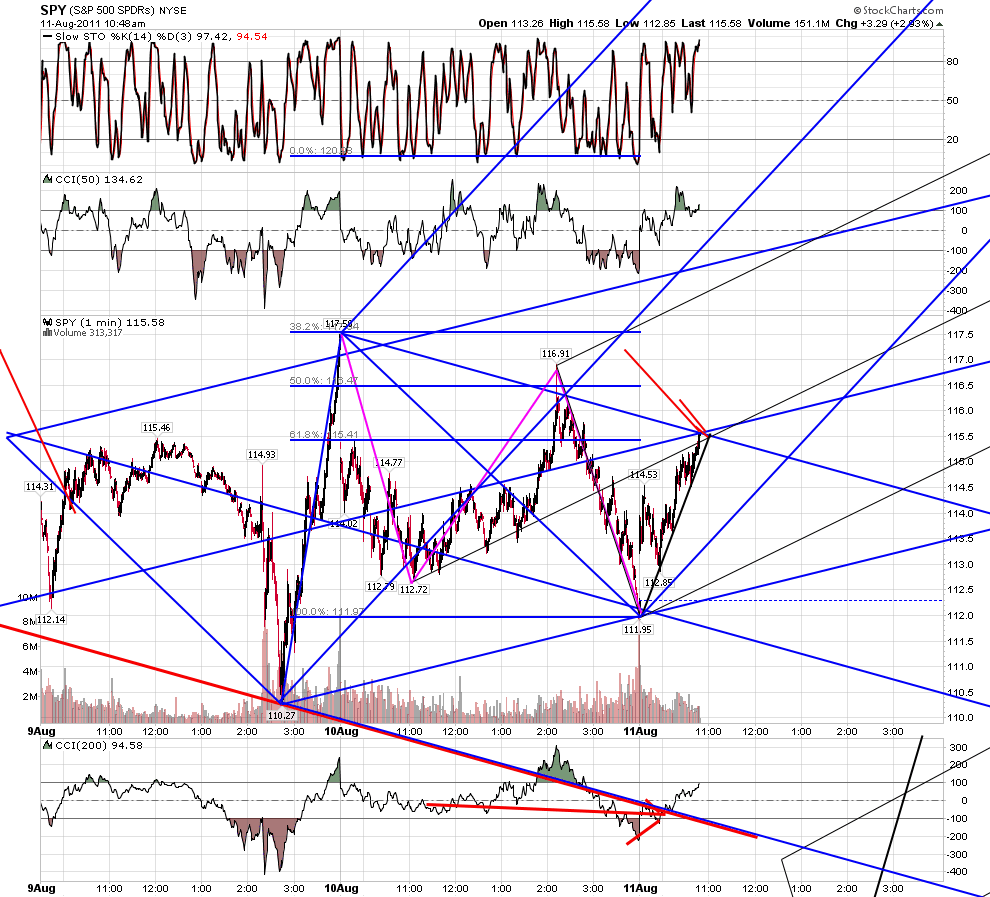
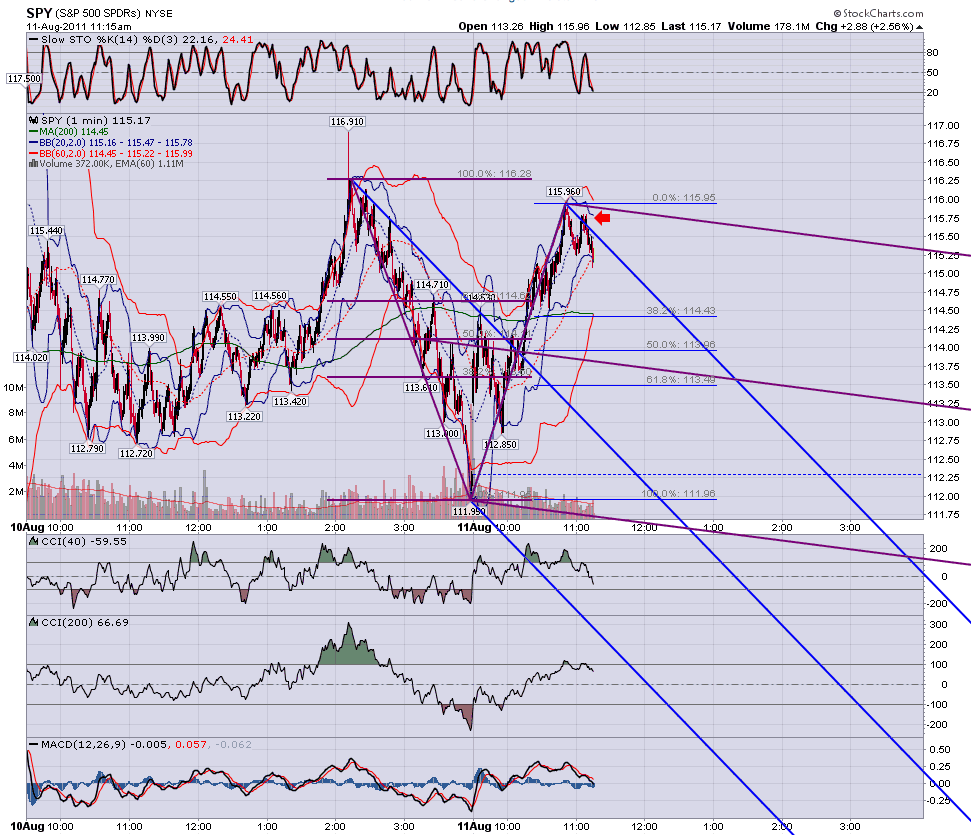
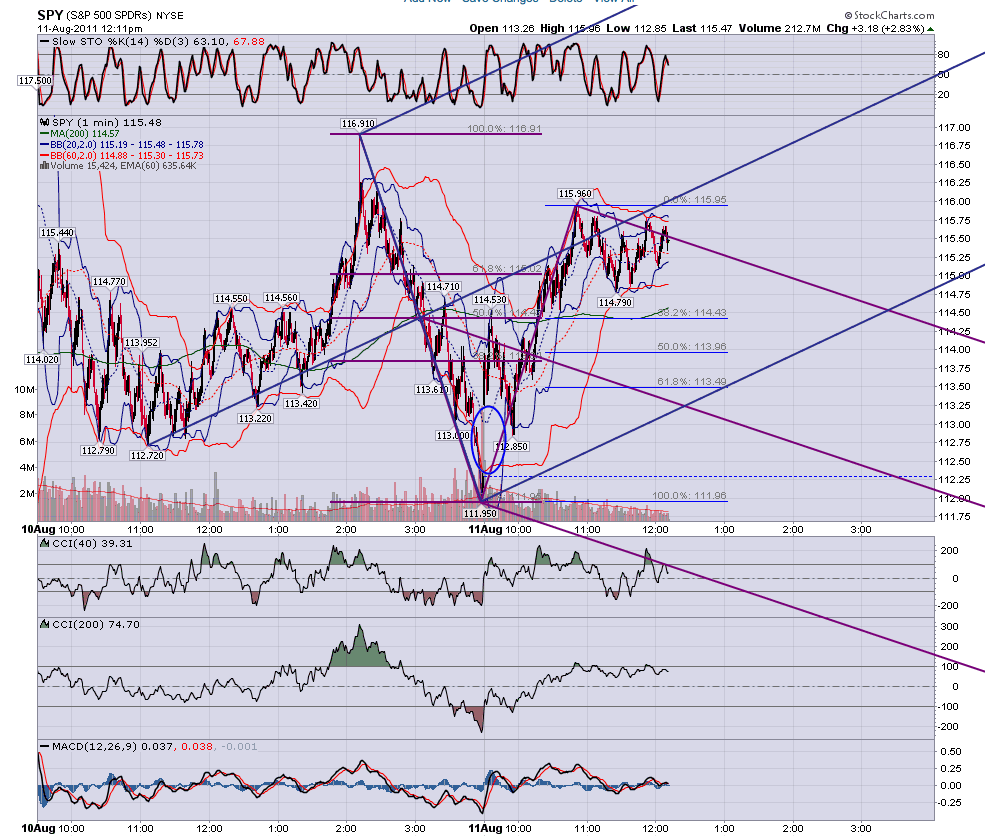
be absolutley sure you are tracking the geometry in all the indexes!!!!!
RA
rat89
Rep: 0
Posts: 7,015
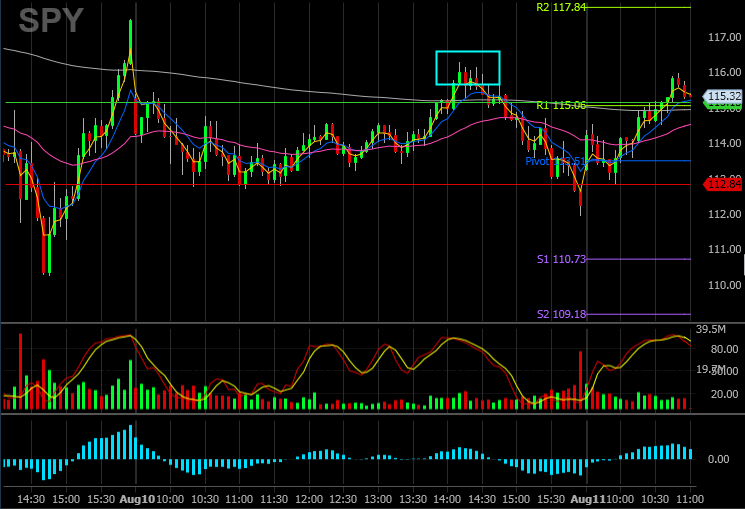
you know what's weird? that 11691 spike showing in stockcharts isn't there in my trading platform - is shows 11628 at 2:10 yesterday....how do you know which is right? that would put .886 at 11687
Originally posted by roofer
decide
Click image for original size
TX
tx_ches
Rep: -10
Posts: 514
I have 116.28 also in tradestation. Depending on your level at stockcharts, you get data only from BATS. So it is possible that it can show a discrepancy. If you subscribe at the highest level, you get data from exchange. Most online web charts like stockcharts, barchart.com, and freestockcharts use bats so presumably they would all match. I checked barchart and it shows the 116.91 spike.
Originally posted by rat89
you know what's weird? that 11691 spike showing in stockcharts isn't there in my trading platform - is shows 11628 at 2:10 yesterday....how do you know which is right? that would put .886 at 11687
RA
rat89
Rep: 0
Posts: 7,015
so does that mean there was a trade up at that level? which level do you use? are they just trying to confuse us?
Originally posted by tx_ches
I have 116.28 also in tradestation. Depending on your level at stockcharts, you get data only from BATS. So it is possible that it can show a discrepancy. If you subscribe at the highest level, you get data from exchange. Most online web charts like stockcharts, barchart.com, and freestockcharts use bats so presumably they would all match. I checked barchart and it shows the 116.91 spike.
Originally posted by rat89
you know what's weird? that 11691 spike showing in stockcharts isn't there in my trading platform - is shows 11628 at 2:10 yesterday....how do you know which is right? that would put .886 at 11687