JI
jimkane
Rep: 3,058
Posts: 33,089
T minus 5 minutes and counting... But we already have some indications from the spot FX market.
JI
jimkane
Rep: 3,058
Posts: 33,089
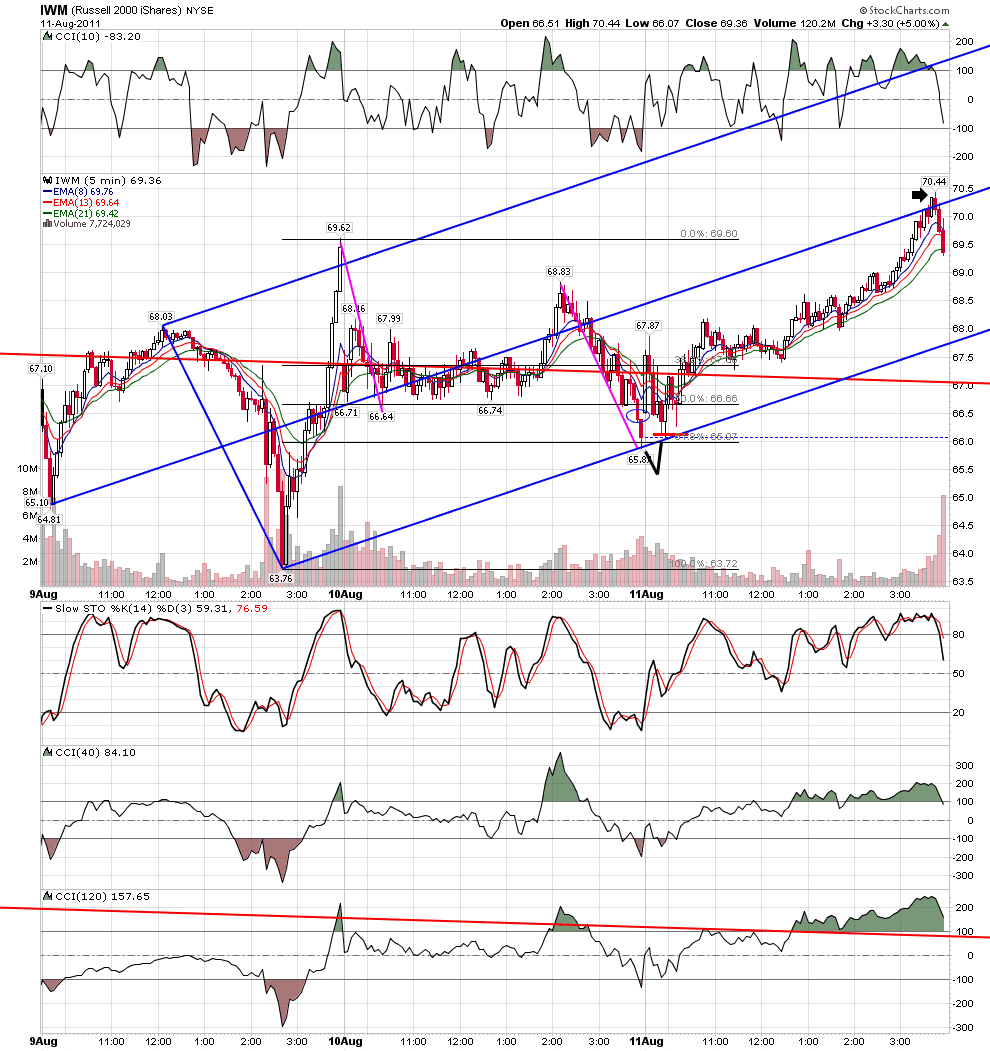
Great work. Pretty much sums up my viewpoint on the day. Notice the small ABCD's on the way up, too.
Originally posted by roofer
TEXTBOOK... price thrusts up... then makes abcd with measured moves to line at .618... today, opens with gap on 5, pullback occurs at.886 on gap on 5 @geometry.... for rest of day there were no sell signals... out at target....
Click image for original size
RO
roofer
Rep: 3,689
Posts: 3,574
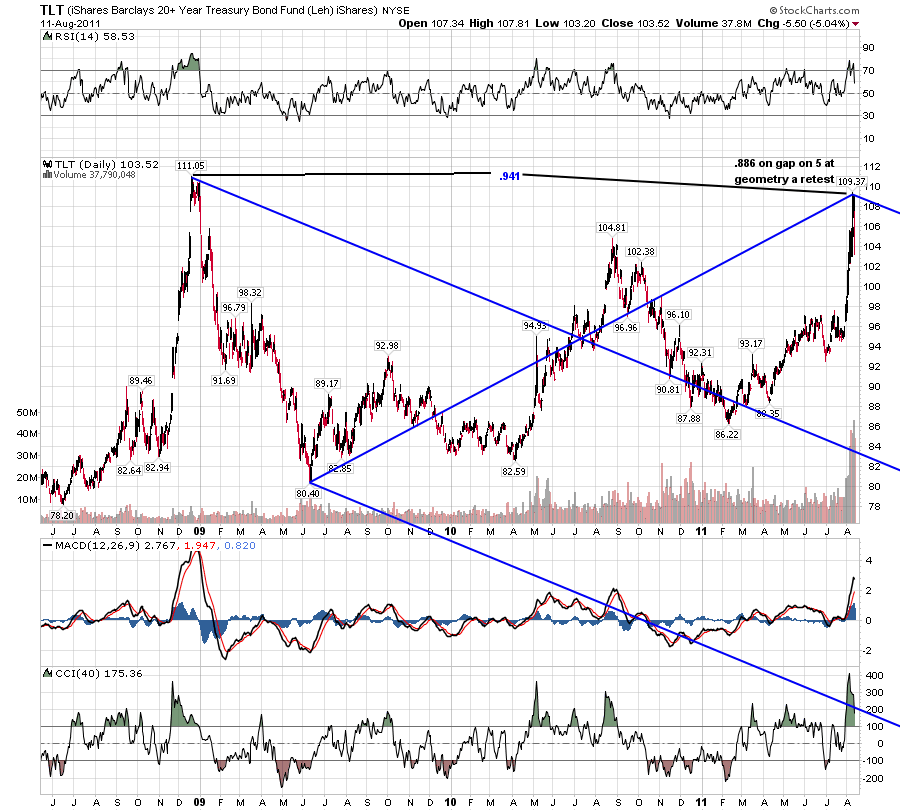
i invite traders who like to do their own work to try to duplicate my private notes of frustration last night based on tbt,dia,fas....
RO
roofer
Rep: 3,689
Posts: 3,574
i gotta tell you, you are more than welcome to say i know but i dont want to do the work to show it..... but if not even one single trader saw what i saw, then i am wasting my time here....
RA
rat89
Rep: 0
Posts: 7,015
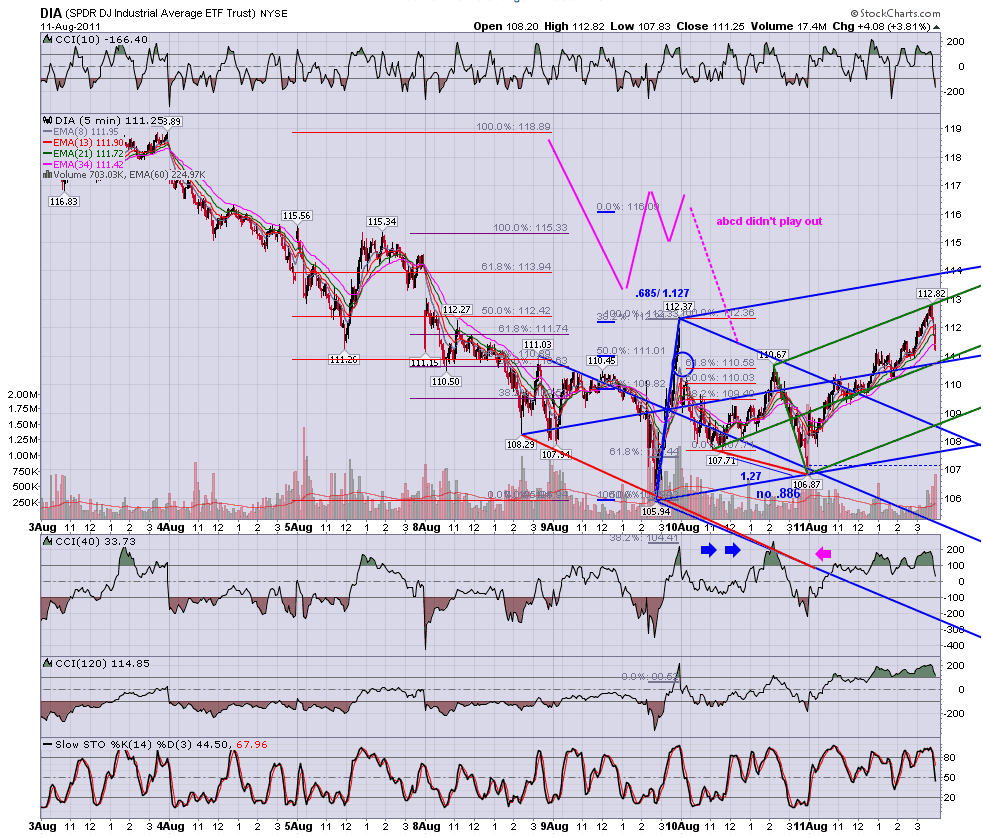
here's what I see in dia...maybe i'm way off...it's the only one I can do...have hours of work for a deadline tomorrow am and have to deliver...if i am way off, then it's possible i'm never going to get it too...
the way I see it, there was a setup to dump dia down into a 1.27 at the lower line, backed up by the abcd ending at 11067....instead price found support at a baby 1.27 at lower line, no convincing relationship to 10594 low....sends it meandering up into a trend day without first dumping into a 1.27 at line or retesting with an .886 first
that's what I see so far
Click image for original size
TX
tx_ches
Rep: -10
Posts: 514
Here's what I see in DIA as of Yesterday's close.
I saw Rat's chart but have not read what he posted with the chart.
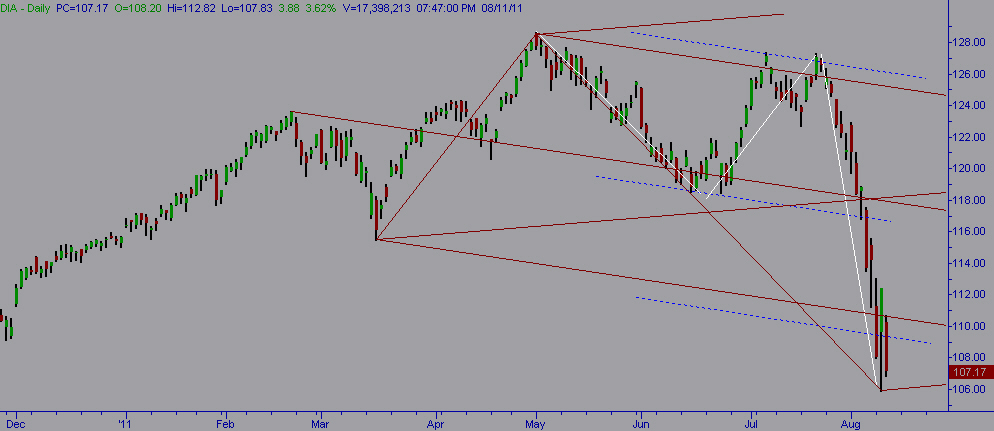
On the Daily, DIA went past the point where it should have turned for a bull abcd - the CD leg is very extended. It also went past the lml and its sliding //. But it got a bounce so there is hope. But the next day (yesterday) had no follow-through to that bounce and closed near its low.
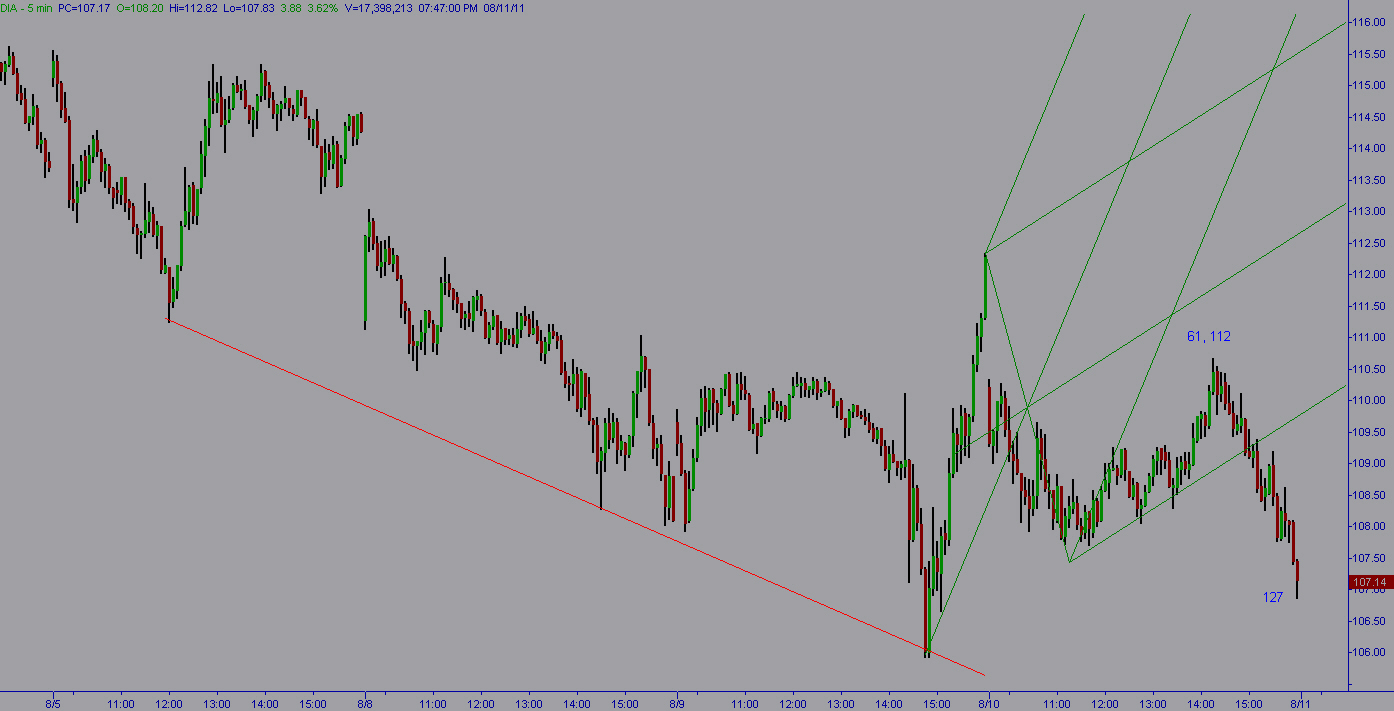
On the 5 minute, there was a 3 touch line. You would expect price to reach the ML. Even with the MLS schiff'd, price fails. It was a gap day, but price did not get any bullish support on a .886. Instead it got bearish resistance on a 1.12.
Your time is valuable here. I hope it is only your physical injuries that may have you feeling discouraged. I don't ever look at fas and tbt but if I have time later, I'll take a stab.
I saw Rat's chart but have not read what he posted with the chart.
On the Daily, DIA went past the point where it should have turned for a bull abcd - the CD leg is very extended. It also went past the lml and its sliding //. But it got a bounce so there is hope. But the next day (yesterday) had no follow-through to that bounce and closed near its low.
Click image for original size
On the 5 minute, there was a 3 touch line. You would expect price to reach the ML. Even with the MLS schiff'd, price fails. It was a gap day, but price did not get any bullish support on a .886. Instead it got bearish resistance on a 1.12.
Click image for original size
Your time is valuable here. I hope it is only your physical injuries that may have you feeling discouraged. I don't ever look at fas and tbt but if I have time later, I'll take a stab.
TX
tx_ches
Rep: -10
Posts: 514
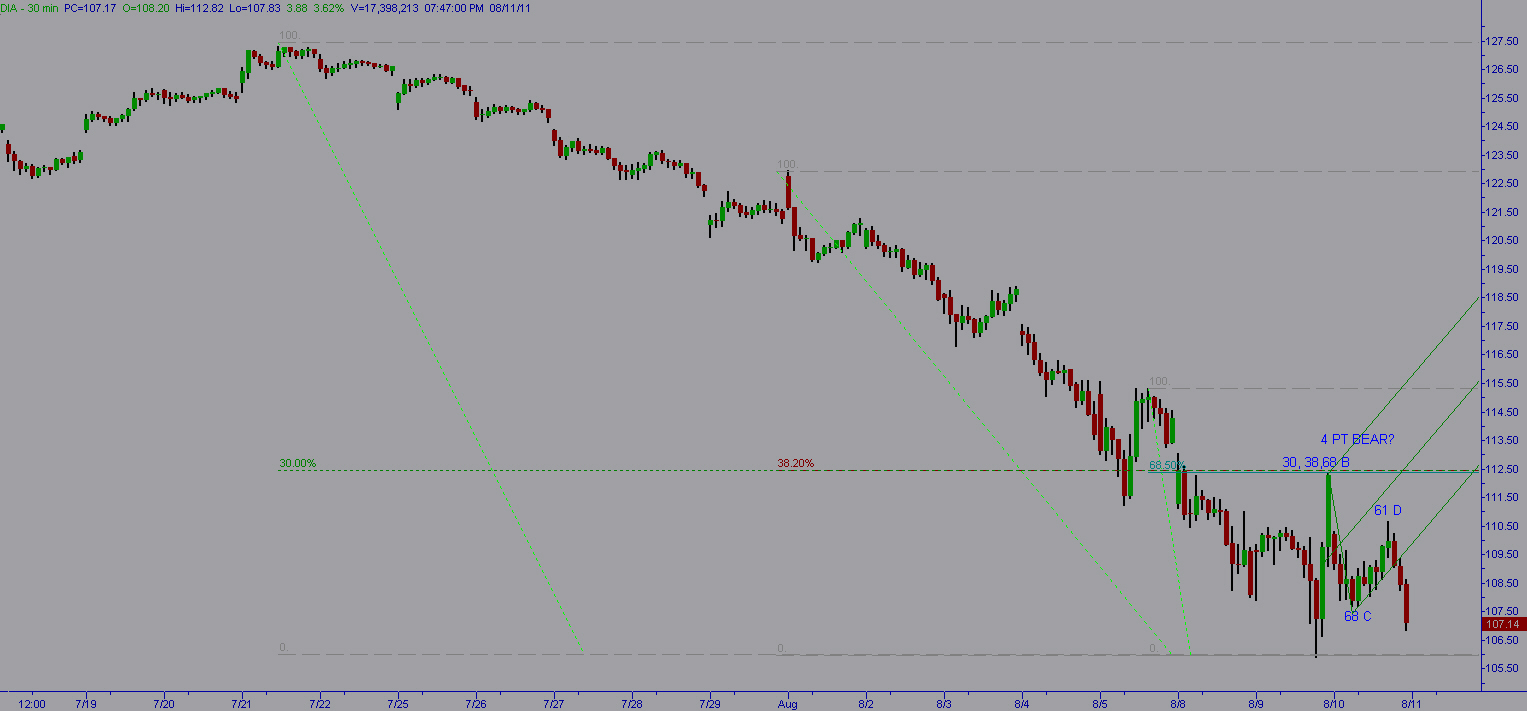
DIA 30 min.
A lesser trader may have thought a 4 pt bear abcd formed on the 30 minute. But I doubt you did.
B would have been at 30, 38.2, 68.5 retraces.
C at 68.5%.
D at 61%.
A lesser trader may have thought a 4 pt bear abcd formed on the 30 minute. But I doubt you did.
B would have been at 30, 38.2, 68.5 retraces.
C at 68.5%.
D at 61%.
Click image for original size