JI
jimkane
Rep: 3,058
Posts: 33,089
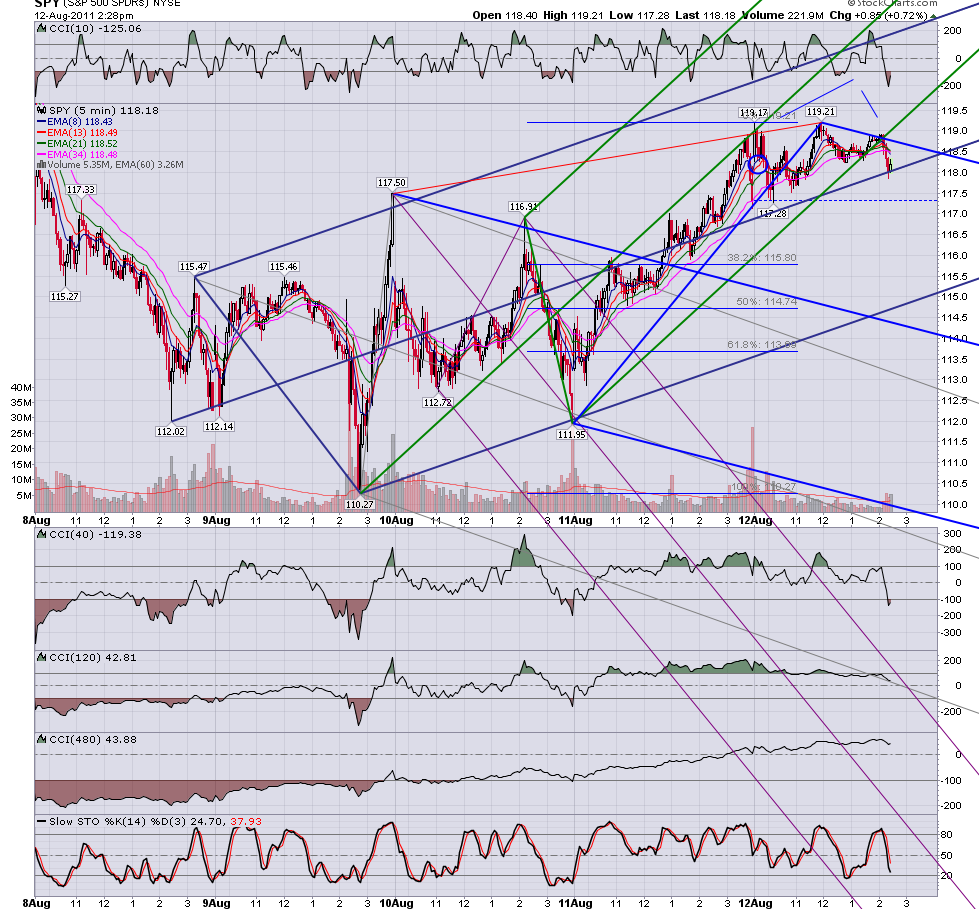
T minus 5 minutes and counting... But we already have some indications from the spot FX market.
RA
rat89
Rep: 0
Posts: 7,015
interesting, roofer....I've been looking at first chart here, backing out far enough to see your reference point makes me wonder about something larger
Click image for original size
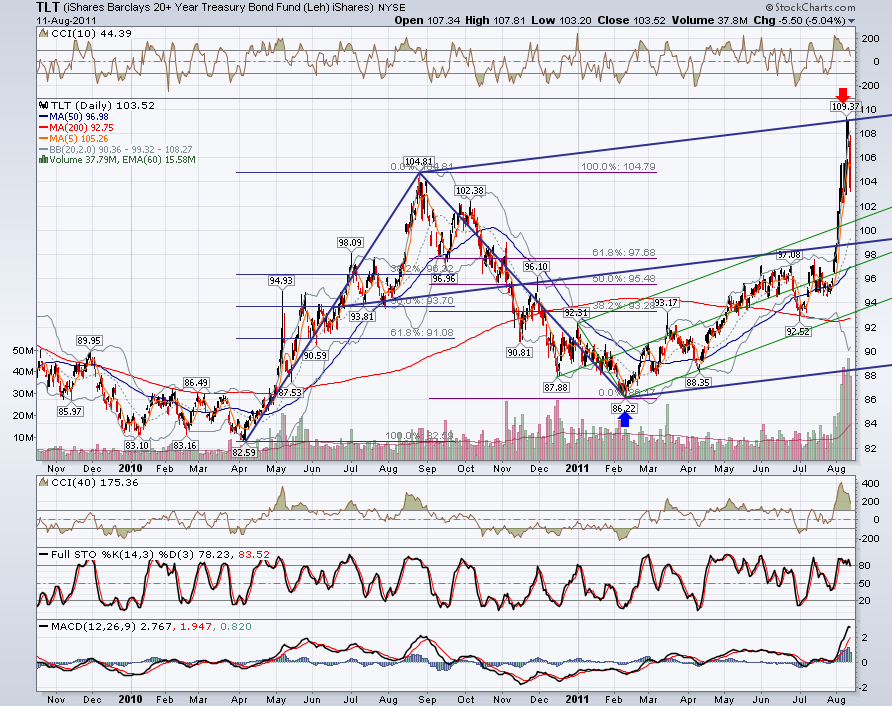
Click image for original size
TX
tx_ches
Rep: -10
Posts: 514
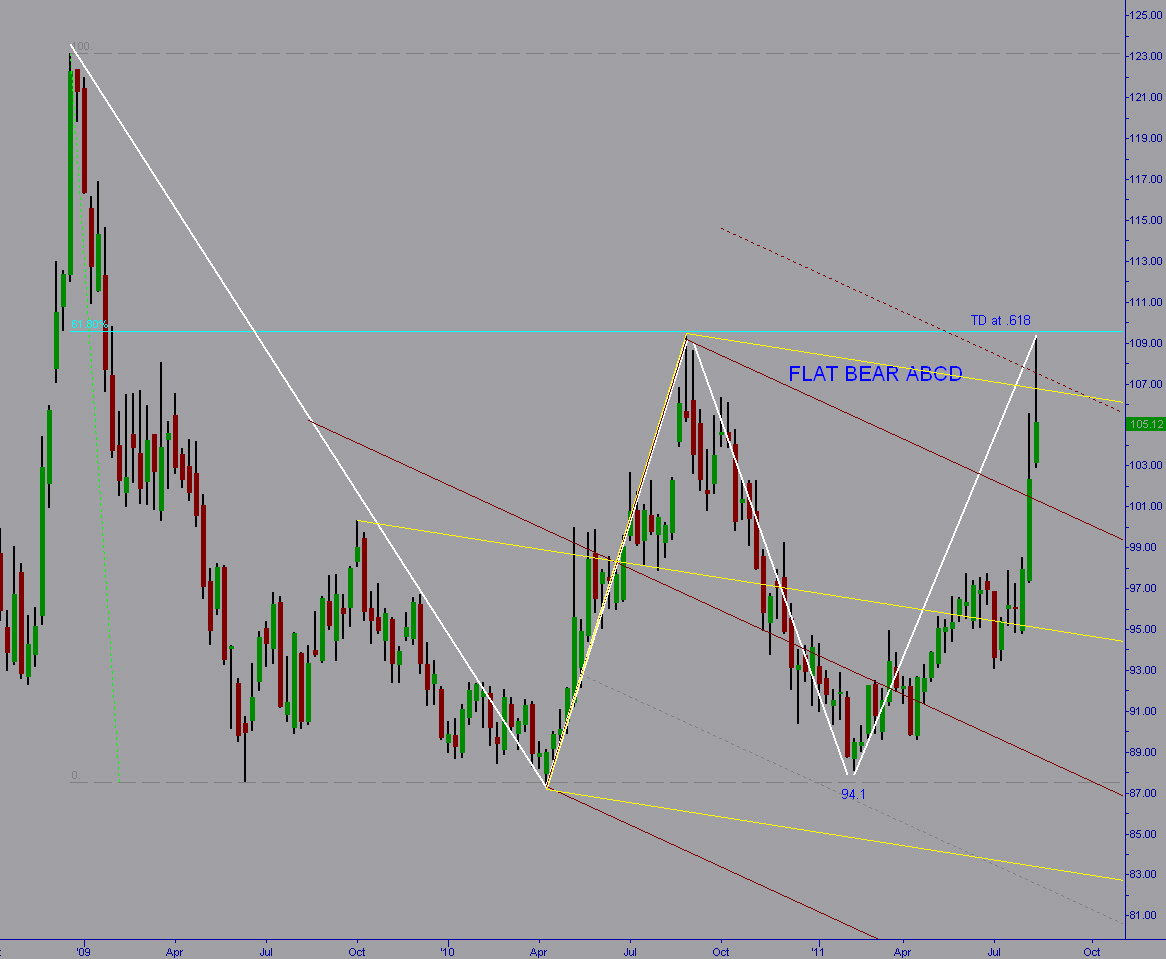
On the TLT Weekly, I have a flat bear abcd near MLS lines with a thrust move to get there..
On the TLT Daily, I have everything the same as weekly but I show the
.618 line for trader's dream at bands with divergence.
For the double top, it was really the 3rd time it acted as a pivot. The first time is hard to see because it is so close to the hard down move.
Click image for original size
On the TLT Daily, I have everything the same as weekly but I show the
.618 line for trader's dream at bands with divergence.
Click image for original size
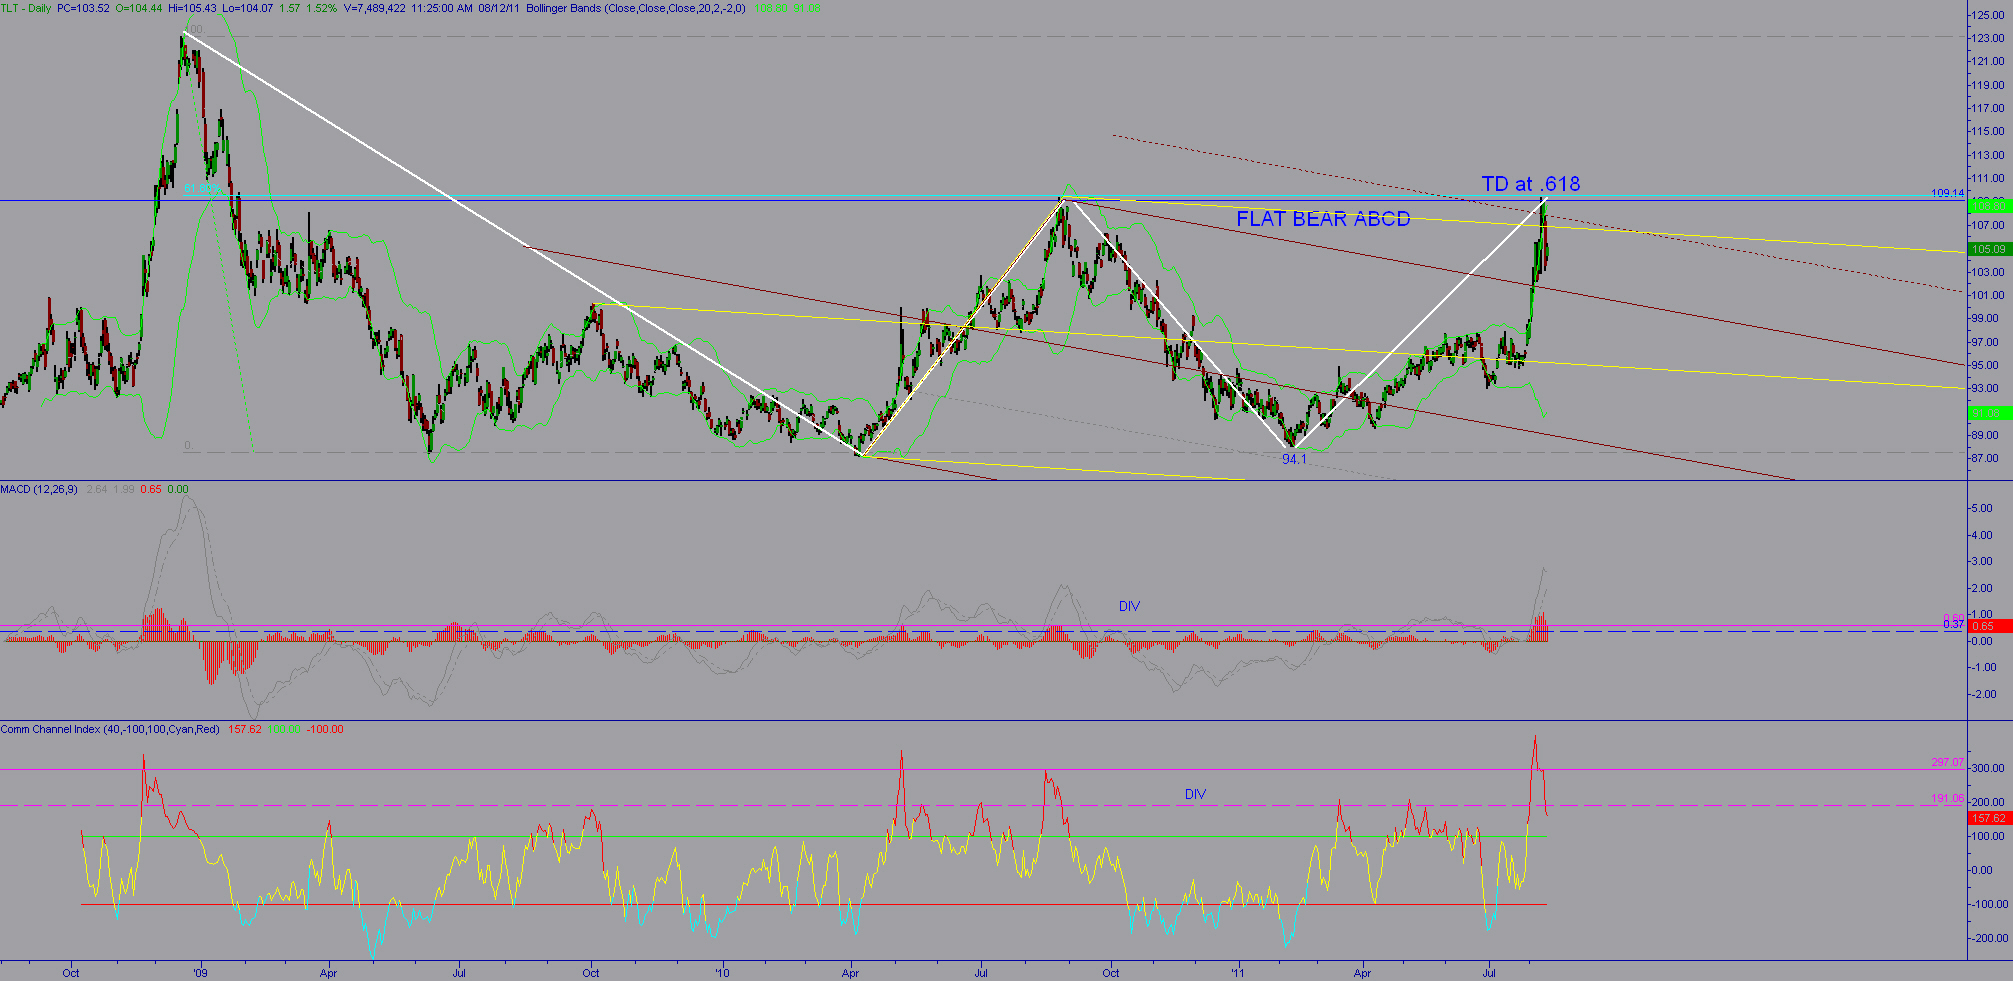
For the double top, it was really the 3rd time it acted as a pivot. The first time is hard to see because it is so close to the hard down move.
TX
tx_ches
Rep: -10
Posts: 514
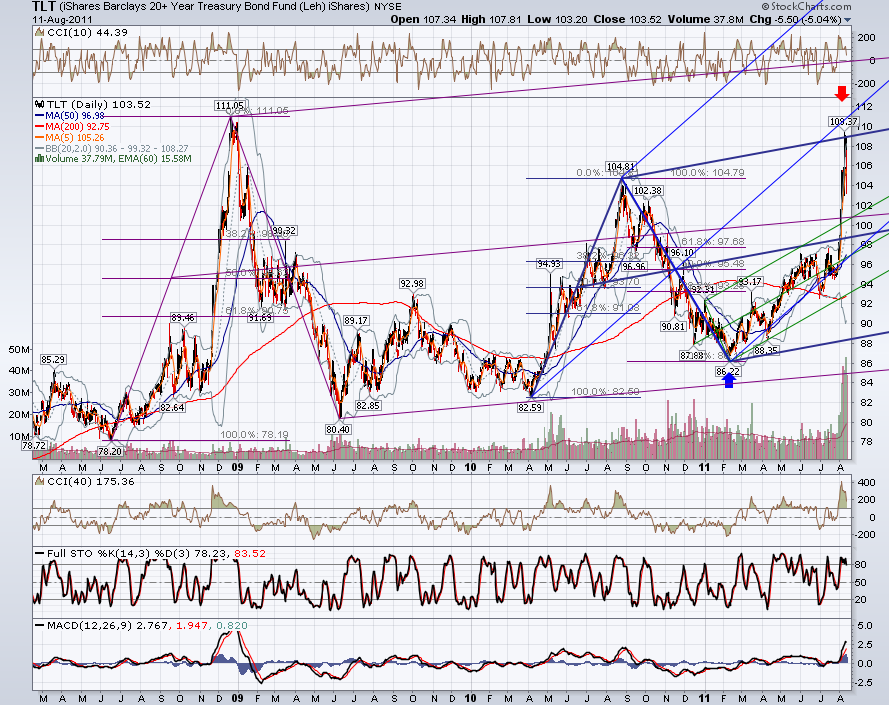
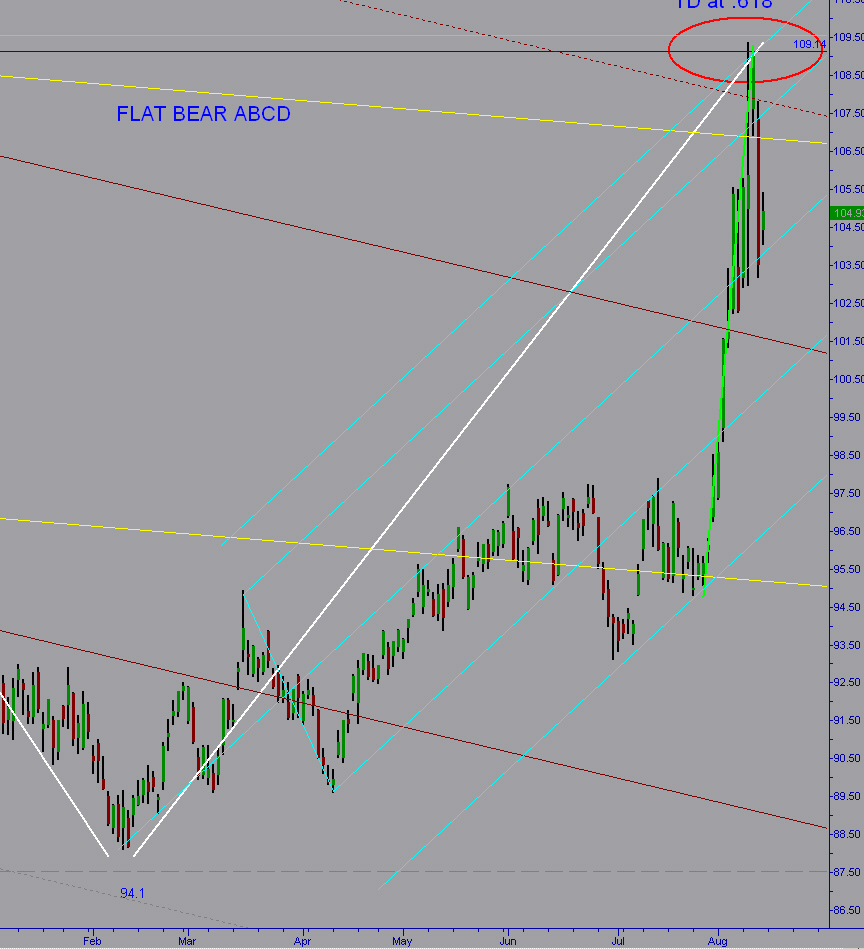
I found another set that I could add on to TLT Daily. It's warning line intersected with the top.
Click image for original size
JI
jimkane
Rep: 3,058
Posts: 33,089
That overhead SL is something. Watch the ABCD here, but something has changed...
JI
jimkane
Rep: 3,058
Posts: 33,089
If this ABCD here doesn't hold, I'm watching:
66.75-67.50
60.50-61.50
Then around 50?
66.75-67.50
60.50-61.50
Then around 50?
RA
rat89
Rep: 0
Posts: 7,015
weird.....this is not what roofer is teaching......886 of 11917 - 117.28 .... don't want to consider it predictive....which tl is going to hold?
Click image for original size