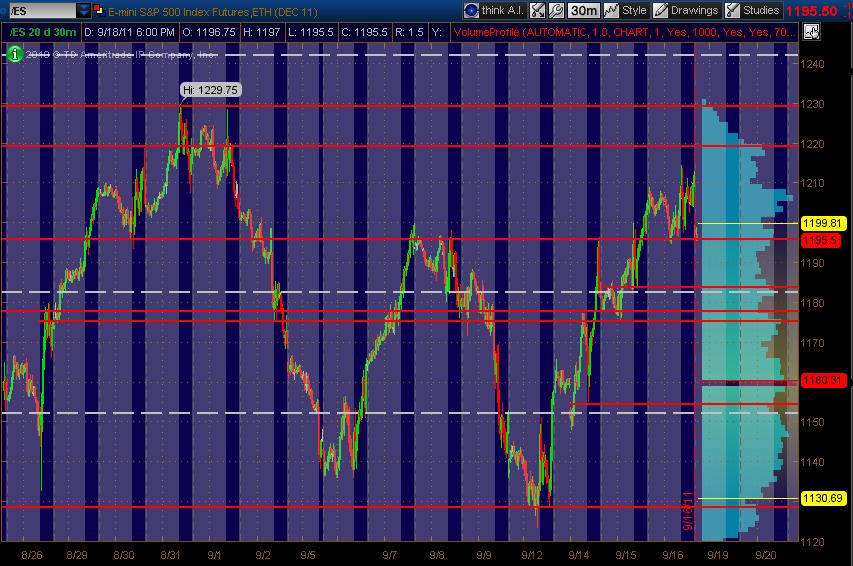
Here's my ES 30min Monkey Map of PASR levels as Red with White dashed lines as Wkly Pivots ... and Volume Profile of the past 20 days on the right vertical axis. The Gray background areas show overnight (non RTH) areas. Have a Fib cluster in and around 1183 as well (though not drawn in). Hope this is helpful.
BR
BruceM
Rep: 216,211
Posts: 19,895
flat on all at 86.50..that was first initiation point ( small contracts)....
BR
BruceM
Rep: 216,211
Posts: 19,895
will look to buy one last time as we still have air at 87.50....waiting to see a signal under 83.75....and long will use 85 as initial target first
BR
BruceM
Rep: 216,211
Posts: 19,895
last ideal long spot is 75 - 77 area if they can push that far...that is a low volume spot...83.75 is gonna print soon I think.....
BR
BruceM
Rep: 216,211
Posts: 19,895
not baosting but the plan worked perfect today!!...except I would like to see 87.50 again...that would make it perfection!!
trying to hold two ror 87.50 but trade back to 82.25 will stop those out
RB
rburns
Rep: 1,896
Posts: 383
Id go broke trying to read todays posts and trade. In the morning I look for Bruces levels and see how they mesh with mine. Reading any more here will probably cause a brain fart {for me anyway}. A 1.5 stop in 35 pts ranges which we have been having is suicidal in my opinion. You can get an execution and stop at the same time. Best wishes and good trading RB