ES Monday 10-31-11
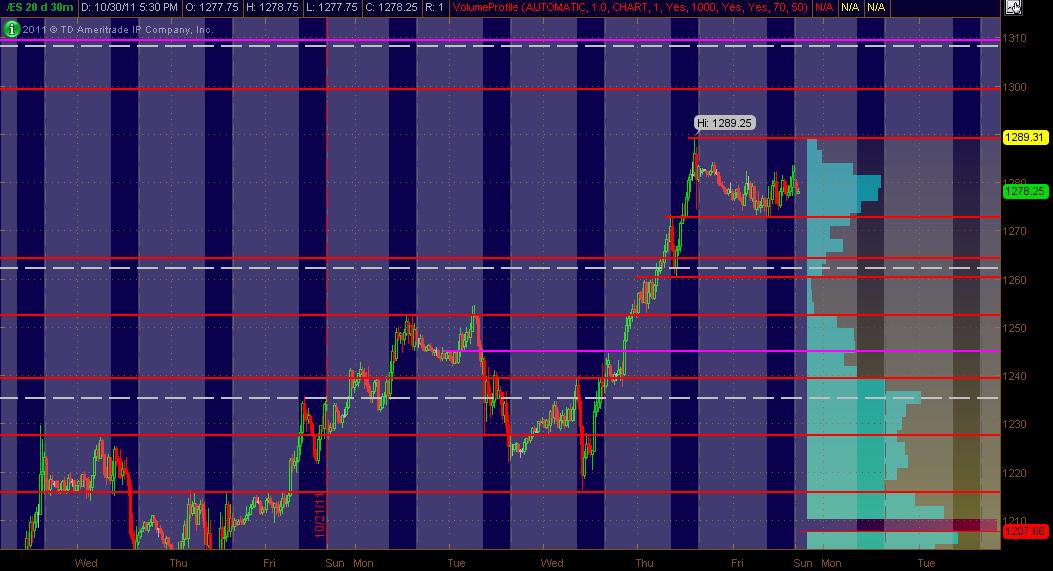
Here's my 20 days worth of 30min chart action displaying All Trading Hours as a MAP of what I'm looking at coming into Monday. The Red lines are potential significant PASR levels with Magenta lines being semi-significant. The White dashed lines are the Wkly Pivots. The right vertical axis shows 20 days of Volume Profile in Light Blue. The background displays RTH in Blue with "after hours" in Gray. Hope this is helpful for some folks.
Click image for original size
If anyone is unable to trade this is why...
http://www.zerohedge.com/news/mf-global-finance-files-bankruptcy
http://www.zerohedge.com/news/mf-global-finance-files-bankruptcy
pathetic volume......
thanksa Lorn..still frozen here...interesting battle between that 66 and that 63 area......the hour range will tell us who wins today
odds don't favor them keeping that 67.50 intact..looking to find a way to get long near 65.50....to get those 67.50's to run out
long 64..not giving this too much below 63
first target is 65.75 and then try for that double top...r
runners stopped ..AGAIN...will try the long one more time as my $Ticks are now back and they are trying to trend UP..
long 64.25
long 64.25
taking something at 65.75 again....wow..they are making trading hard today...LOL!!
bruce looks like we are filling in that LV from thur but we still have LV 69.50 to 73.00 qwestion is fill in today or stay below and close gap
no doubt us longs need this to stay above the 63 - 64.50..I raised the level up because developing volume node is in there now
Careful with shorts here
Click image for original size
Emini Day Trading /
Daily Notes /
Forecast /
Economic Events /
Search /
Terms and Conditions /
Disclaimer /
Books /
Online Books /
Site Map /
Contact /
Privacy Policy /
Links /
About /
Day Trading Forum /
Investment Calculators /
Pivot Point Calculator /
Market Profile Generator /
Fibonacci Calculator /
Mailing List /
Advertise Here /
Articles /
Financial Terms /
Brokers /
Software /
Holidays /
Stock Split Calendar /
Mortgage Calculator /
Donate
Copyright © 2004-2023, MyPivots. All rights reserved.
Copyright © 2004-2023, MyPivots. All rights reserved.