ES Monday 10-31-11
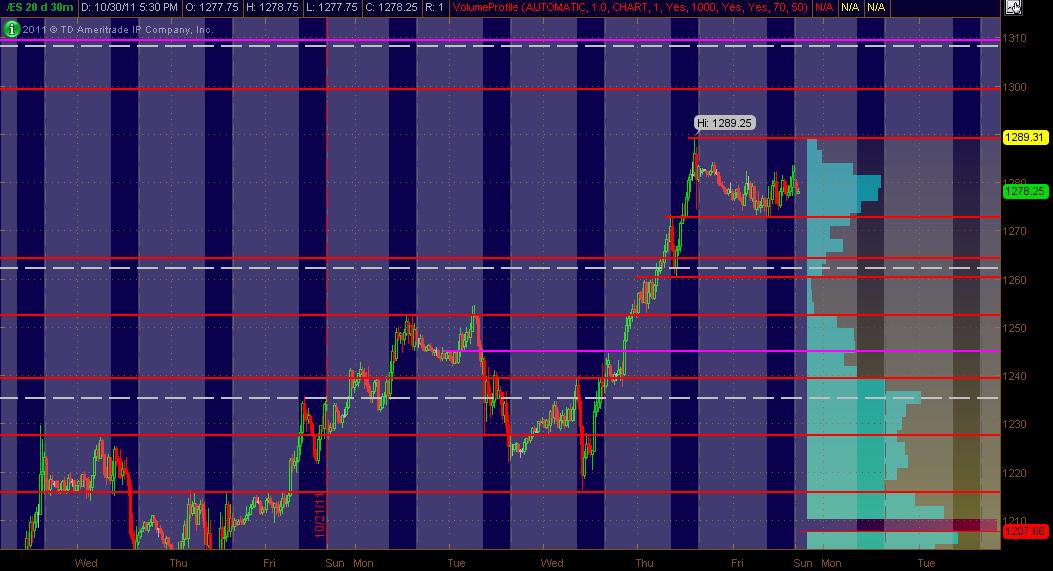
Here's my 20 days worth of 30min chart action displaying All Trading Hours as a MAP of what I'm looking at coming into Monday. The Red lines are potential significant PASR levels with Magenta lines being semi-significant. The White dashed lines are the Wkly Pivots. The right vertical axis shows 20 days of Volume Profile in Light Blue. The background displays RTH in Blue with "after hours" in Gray. Hope this is helpful for some folks.
Click image for original size
Bruce could you please show your $tick chart or line, what time frame do you use it on?
No rush to answer whenever you have time it's ok
No rush to answer whenever you have time it's ok
David,
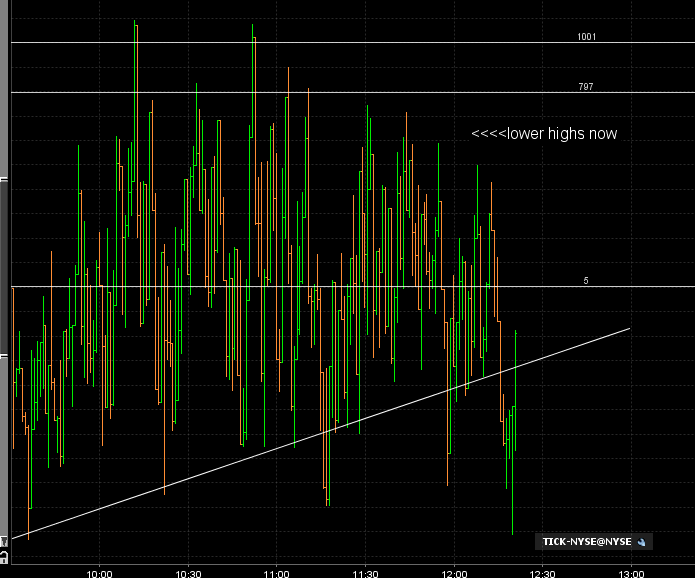
I'm watching how much time is spent under that line and also if we get lower highs...this seems to be happening now and the distribution now seems to changing to the downside.
One of two quick pokes under the upward sloping line is ok but once we start getting more than that with the lower highs it's time to think that the market mood may be changing...u can use any time frame but I prefer one or 5 minute...I like to see xtremes in Tick with air pockets....a differnt subject
Originally posted by khamore1
Bruce could you please show your $tick chart or line, what time frame do you use it on?
No rush to answer whenever you have time it's ok
Click image for original size
I've taken 8 trade campaigns today...3 total losers ( one was overnight)...no runners hit final targets...in fact only one campign went beyond intial target to get a secondary contract..
this is also on the very high end of campaigns for me.
willlook to work the 59 - 60 area longs but it gets difficult as we may really trend soon after so much consolidation....hope not!!
this is also on the very high end of campaigns for me.
willlook to work the 59 - 60 area longs but it gets difficult as we may really trend soon after so much consolidation....hope not!!
on the 59.75 long..air above..high risk...ticks hit minus 1200
all longs will try for 61.25 first....tricky longs here as mentioned
runners trying for 63 even...let's see if the 9th time is the charm
if the even steven is gonna work we can still see 67 and higher so trying to hold last two for new highs on the day!!
took one more at 65.50...OR low....last is trying for new highs to finally run that double top
I got stopped at 64.75....as long as we hold trade above the low volume at 61.50 we should go on to bust that double high and go back up into the 71 area today...will look one more time on the long above 61.50 but then will wait until 52 - 54 prints
if we start revisiting the 61.50 then we need to be thinking that we may see some agressive selling into the close....I won't fade the 59 area again but I would try longs at the 52 - 54 area
if we start revisiting the 61.50 then we need to be thinking that we may see some agressive selling into the close....I won't fade the 59 area again but I would try longs at the 52 - 54 area
Careful with shorts here
Click image for original size
Emini Day Trading /
Daily Notes /
Forecast /
Economic Events /
Search /
Terms and Conditions /
Disclaimer /
Books /
Online Books /
Site Map /
Contact /
Privacy Policy /
Links /
About /
Day Trading Forum /
Investment Calculators /
Pivot Point Calculator /
Market Profile Generator /
Fibonacci Calculator /
Mailing List /
Advertise Here /
Articles /
Financial Terms /
Brokers /
Software /
Holidays /
Stock Split Calendar /
Mortgage Calculator /
Donate
Copyright © 2004-2023, MyPivots. All rights reserved.
Copyright © 2004-2023, MyPivots. All rights reserved.